
Abstract
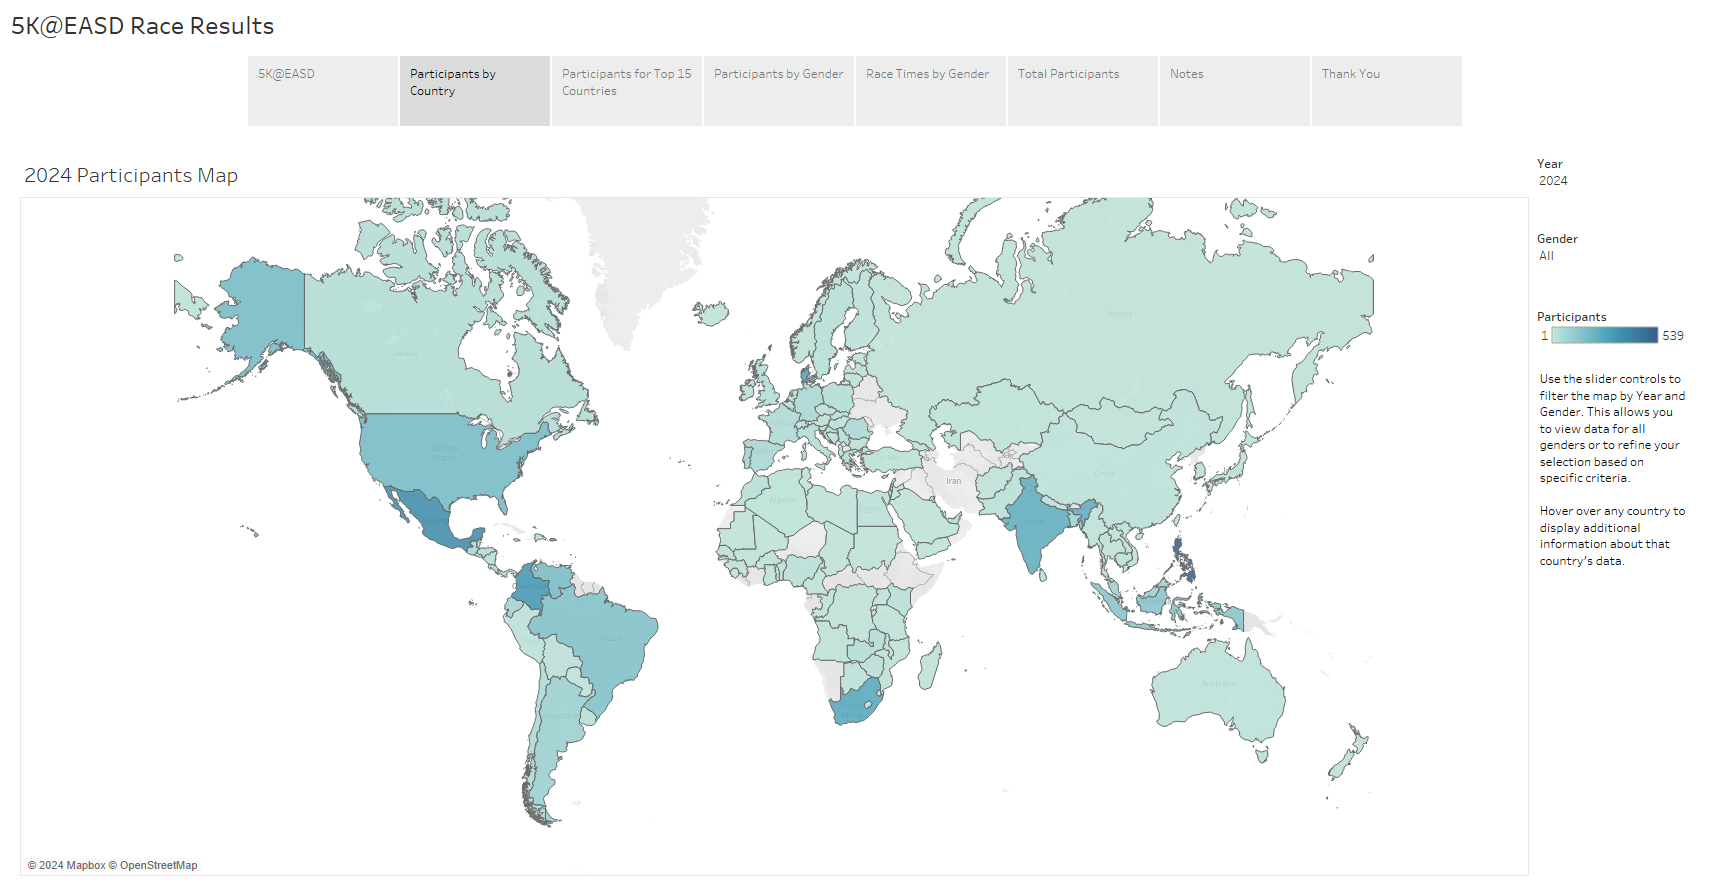
This post explores participation trends from the 2023 and 2024 5K@EASD events, highlighting the role of physical activity in diabetes management. Key insights include geographic distribution, gender-based participation, and race performance trends. Interactive Tableau visualizations offer a detailed, data-driven analysis of how the event's engagement has evolved over two years.
Key Points

Abstract
Explore advanced Python techniques for efficient data retrieval, focusing on handling large datasets, optimizing API calls, and ensuring data integrity. Whether you're working in healthcare analytics, financial modeling, or large-scale data science, these strategies will enhance your workflow and analysis capabilities.
Key Points
The 5K@EASD virtual 5K run/walk event is coming soon! Registration opens Monday July 15.
Registration is free.
The 5K@EASD Virtual Challenge will bring together people across the globe as well as EASD attendees to emphasize the need for increased physical activity to help prevent diabetes and diabetes complications. This disease awareness activity provides participants with the opportunity to raise public awareness about the importance of a healthy lifestyle in preventing and controlling diabetes.
The 5K@EASD is sponsored by Novo Nordisk and the World Diabetes Foundation. It takes place in conjunction with the European Association for the Study of Diabetes (EASD) annual conference.
I do the walk on the treadmill at the gym. This way I can have my earbuds in, easily track my progress and not have any interruptions.
Upload your race time any time between the race start and end dates.
5K@EASD Virtual Challenge
https://www.easd5k.com/
September 7 through September 11, 2024
Registration opens July 15. Personalized bibs will be available August 7. Finisher certificates will be available September 8.
Continue driving change in diabetes by running or walking the 5K@EASD in Madrid or from your home city!
#EASD2024 #5KEASD #DiabetesAwareness #DrivingChange

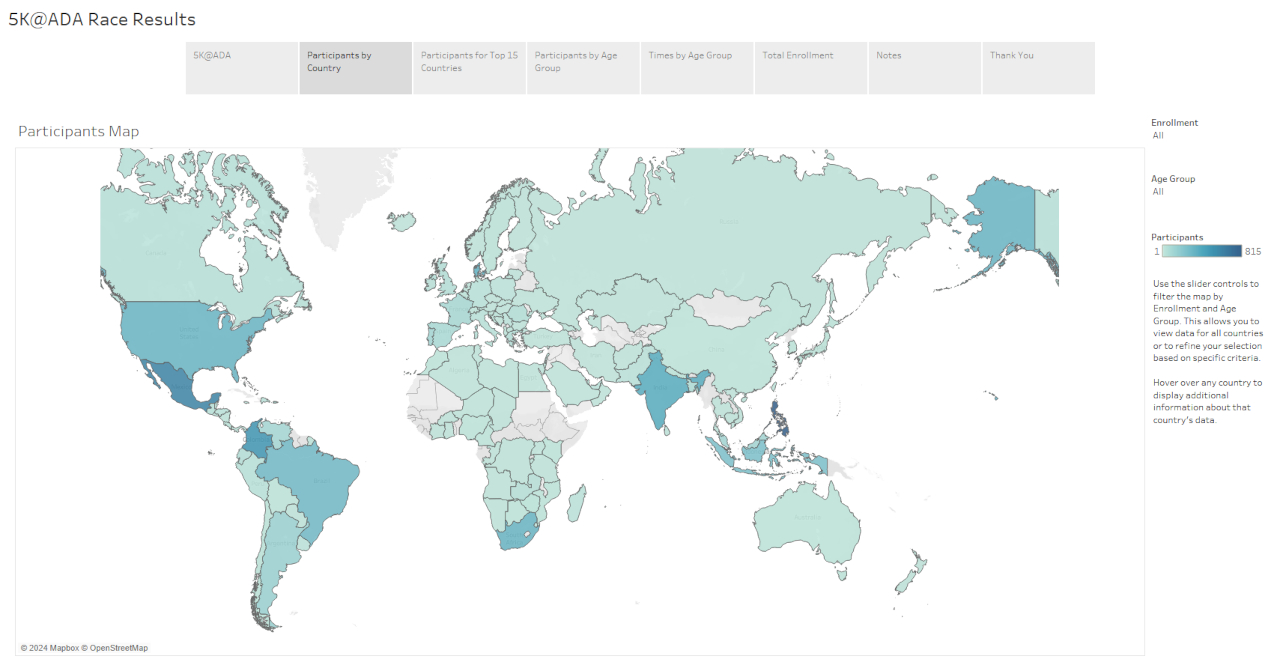
Explore the visualization of 5K@ADA race results using Tableau. Learn how to create interactive maps and charts that showcase geographic distribution and performance metrics. Discover how calculated fields and interactivity features in Tableau make the data analysis both engaging and informative.
Key Points
Page 4 of 9