A project’s real value comes from how well it adapts as the data changes.
Abstract
The 5K@ADA race results project has been updated for 2025 with improvements to data storage, cleaning, and visualization. Key enhancements include the use of SQLite for managing multi-year data, SQL-based deduplication, handling of multilingual gender values, and updated Tableau dashboards with year-based logic. These changes improve scalability, accuracy, and long-term usability.
Key Points
- Integrated SQLite to support multi-year data storage and eliminate reliance on separate CSV files.
- Shifted deduplication to SQL, improving efficiency and simplifying logic.
- Added handling for foreign language values in the Gender column during data cleaning.
- Removed the Name column before export to streamline the dataset and protect privacy.
- Updated Tableau visualizations to support dynamic year selection and adaptable group labels.
Projects rarely stay the same for long. As new data becomes available and better tools come along, it's often necessary to revisit and adapt earlier work. That’s exactly what happened with the 5K@ADA race results project. What started as a web scraping exercise has now grown into a more sustainable analytics workflow, with updated Python code, a redesigned database approach, and revised Tableau visualizations to match.
Why the Update?
With the release of the 2025 race results, we now have multiple years of data to manage. The original workflow was file-based—fine for a single year, but not ideal as the dataset grew. The updates in this cycle focus on:
- Simplifying data storage using SQLite instead of managing multiple CSVs.
- Improving data quality and consistency with new cleaning steps.
- Extending the visualizations to support multi-year comparisons.
These changes keep the project sustainable, scalable, and easier to maintain.
Key Changes
1. Download Script Update
The scraping script remains largely unchanged, aside from updating the race results URL to point to the 2025 data. Comments were cleaned up for readability, removing step numbers that were no longer needed.
2. SQLite Integration for Data Cleaning
The biggest shift is in how the data is stored and deduplicated. Instead of writing cleaned results directly to a CSV, the data is now stored in an SQLite database. This approach provides:
- Efficient deduplication: SQL handles set-based operations well, making it easier to identify and drop duplicates.
- Long-term storage: Multiple years of data can be managed in one place without file clutter.
- Faster iteration: You can run updates without reloading and checking multiple CSVs manually.
Python still handles the initial loading and cleaning. SQL now takes over for deduplication and storage.
3. Handling Foreign Language Values
The 2025 results include gender data, and some values appeared in languages other than English. These values are translated on the web interface but appear in raw downloads. A new step in the cleaning script replaces those foreign language values before storage.
4. Name Column Dropped Before Export
The Name column is still used internally for deduplication but is removed before exporting to CSV for visualization. This helps avoid unnecessary exposure of identifiable information and keeps the visualization dataset lean.
Tableau Visualization Updates
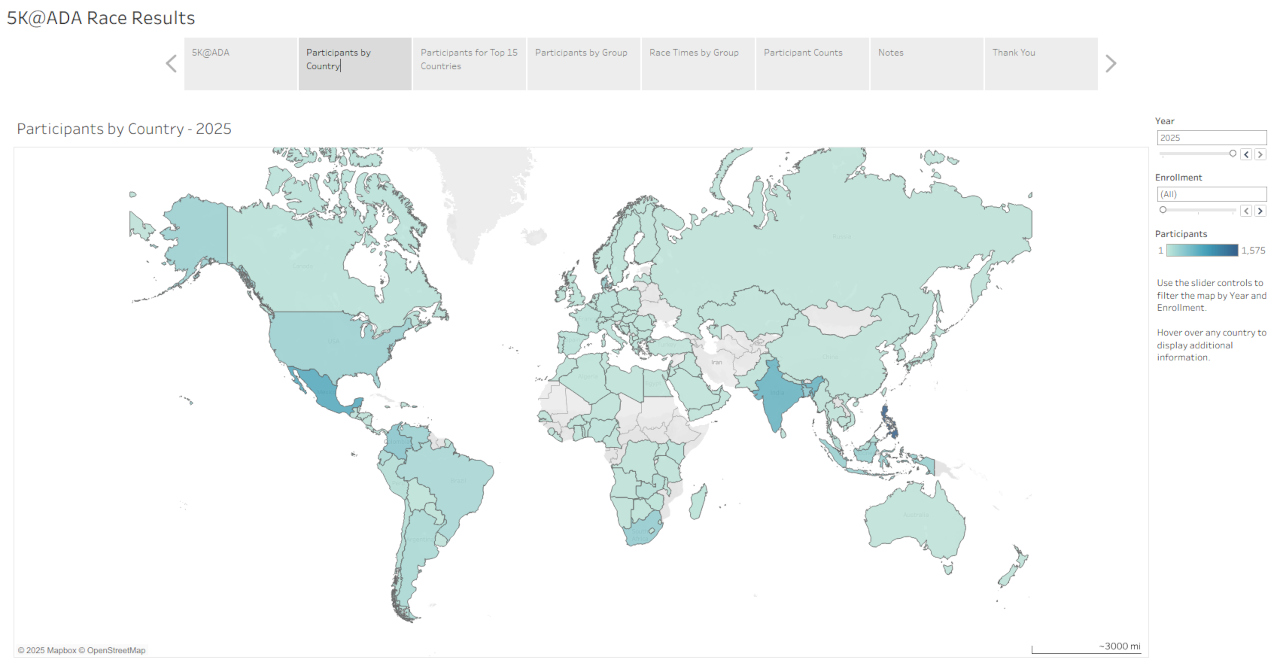
The visualizations have been updated to reflect the inclusion of both 2024 and 2025 data:
- New year selector: Viewers can now choose between 2024 and 2025.
- Group labels adapt by year: The 2024 data uses "Age Group" while 2025 introduces "Gender". Dynamic titles reflect this: “Participants by Age Group – 2024” and “Participants by Gender – 2025”.
- Updated filters: Previous selectors for "Age Group" and "Enrollment" were replaced with "Year" and "Enrollment" for clarity.
- Story point title cleanup: Titles were revised to use the more flexible label "Group" instead of always specifying "Age Group".
What This Means Going Forward
These updates show how a project evolves with new requirements. Moving from CSV to SQLite improved performance and simplified the process of managing historical data. Similarly, adjusting for multilingual data and updating visualization labels keeps the outputs accurate and relevant.
For readers following the project or adapting it to their own needs, this serves as a reminder: workflows should evolve with the data. Taking time to refactor your tools pays off when you're working with real-world datasets that grow over time.
Original Posts
Gathering 5K@ADA Race Results
Visualizing 5K@ADA Race Results
Resources
Python Code at GitHub
Visualizations at Tableau Public
Tableau Training


