Abstract
This post explores participation trends from the 2023 and 2024 5K@EASD events, highlighting the role of physical activity in diabetes management. Key insights include geographic distribution, gender-based participation, and race performance trends. Interactive Tableau visualizations offer a detailed, data-driven analysis of how the event's engagement has evolved over two years.
Key Points
- The 5K@EASD promotes physical activity to support diabetes management, similar to the 5K@ADA.
- Data from the 2023 and 2024 events are analyzed to highlight trends in participation.
- Geographic distribution of participants and gender-based trends are explored.
- Interactive visualizations created in Tableau provide insights into performance and participation metrics.
- The analysis identifies evolving trends in gender representation and race times across two years.
Introduction
The 5K@EASD event, like the 5K@ADA, promotes physical activity and raises awareness of the role an active lifestyle plays in diabetes management. Data from the 2023 and 2024 events present an opportunity to explore trends over these two years.
The data collection process for the 5K@EASD mirrors that of the 5K@ADA. Selenium and BeautifulSoup were used to navigate dynamic web pages and efficiently extract race results. A key difference between the datasets is participant categorization: while the 5K@ADA organizes participants by age, the 5K@EASD organizes by gender. Visualizations were updated to ensure consistency in the analysis across both events.
The 5K@EASD posts general participant data with no sensitive information, such as age, email, or precise location. The site has no restrictions on automated data collection methods. We'll walk through the process of setting up our tools, handling tables, managing pagination, and preparing our data for analysis.
Key Visualizations and Insights
Visualizations created in Tableau highlight gender-based trends and other key insights from the 5K@EASD data.
Geographic Distribution of Participants
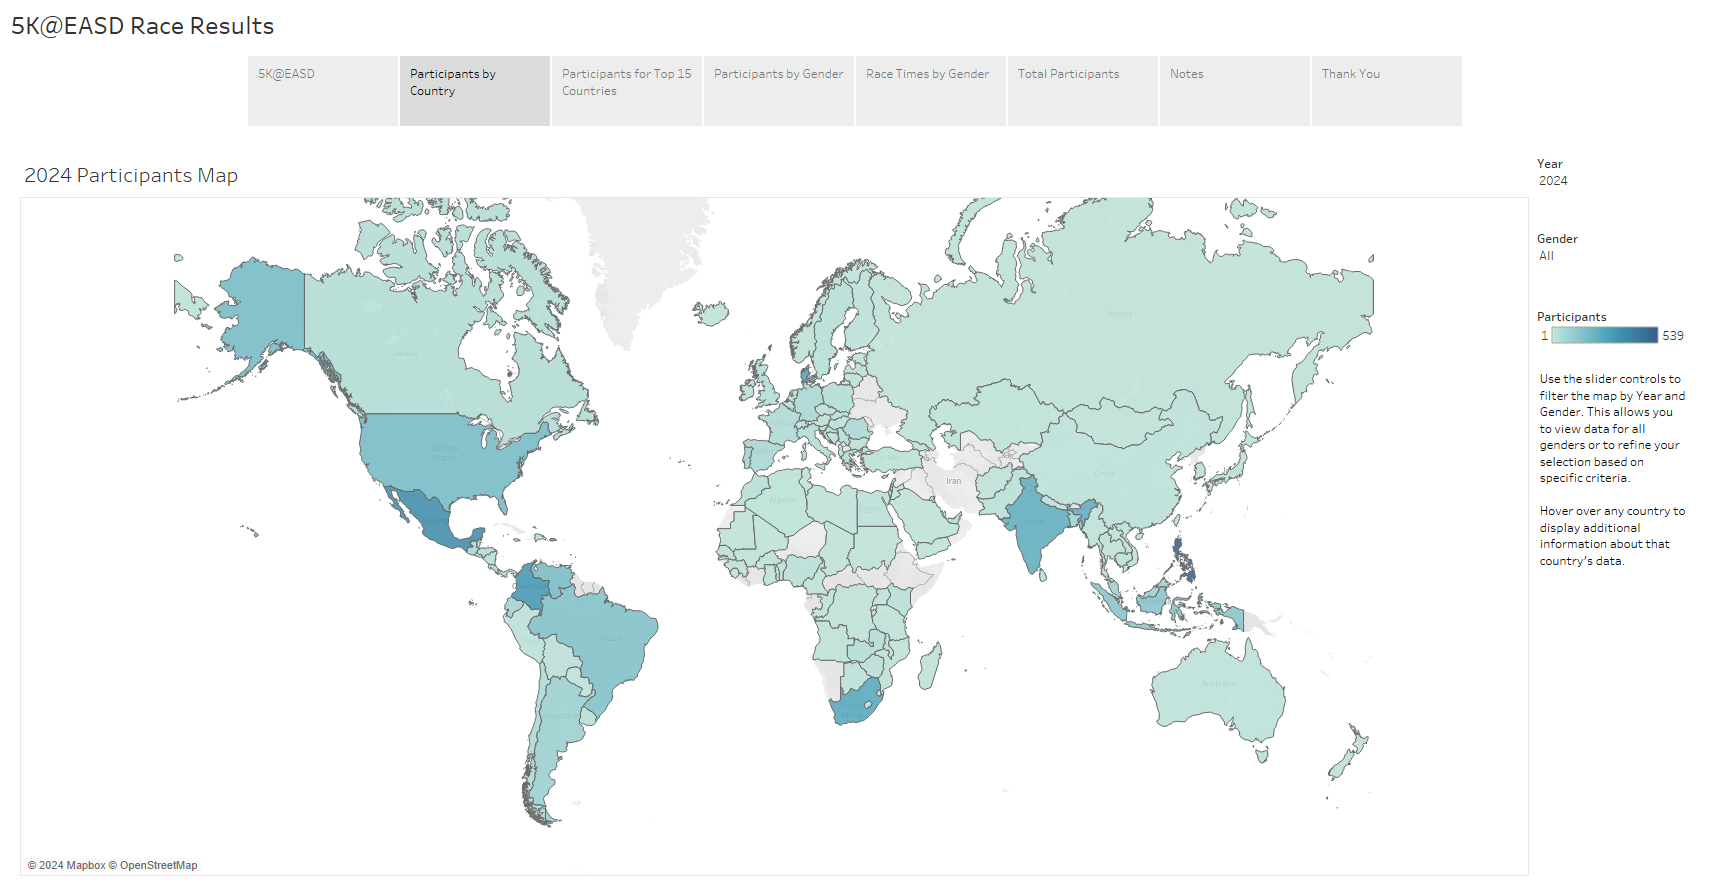
This map visualizes where participants come from, highlighting participation density and gender distribution by country. With slider controls for dynamic filtering, it provides an in-depth look at how participation varies by gender and region, offering a detailed view of the event’s global reach.
Top Participating Countries
This bar chart displays the top 15 countries by participation numbers. Filters allow exploration of male and female representation, showing how gender influences participation across regions. This helps identify countries with the highest engagement levels across genders.
Participants by Gender
An interactive chart shows the number of participants by gender and how the counts differ between 2023 and 2024. This highlights shifts in gender representation across both years.
Race Times by Gender
This interactive chart compares race times across gender categories. Users can toggle between minimum, average, and maximum times to uncover performance trends. The visualization highlights whether significant differences exist between male and female race times and how these trends have evolved between 2023 and 2024.
Total Enrollment by Year and Gender
A text chart presents total enrollment by gender for both 2023 and 2024, offering a broad view of participation levels and illustrating trends in overall engagement.
Sharing the Visualizations
As with the 5K@ADA race results, these visualizations are published on Tableau Public, allowing readers to interact with the data. Filters for gender and time measures enable detailed exploration of participation trends.
Summary
The 5K@EASD race data reveals key trends in participation, geographic reach, and performance. A comparison between 2023 and 2024 shows how the event is evolving. Readers are encouraged to explore the interactive visualizations to uncover deeper insights.
For more details on the technical process behind the data collection, refer to the post on Complex Web Scraping with Python. For further analysis, see the post on Visualizing the 5K@ADA Race Results.
Visualizations at Tableau Public
Frequently Asked Questions
Are there specific health benefits linked to participation in these 5K events for people with diabetes?
Engaging in physical activity, like a 5K run or walk, can have significant health benefits for people with diabetes. Regular exercise helps improve insulin sensitivity, lower blood glucose levels, reduce cardiovascular risk, and promote overall well-being. However, individual benefits vary, and people should consult their healthcare provider before starting a new fitness routine.
How does participation in the 5K@EASD compare to other similar events outside of diabetes-related conferences?
The 5K@EASD and 5K@ADA are unique in their focus on diabetes management awareness. While other 5K events promote general health and fitness, these events specifically aim to educate and raise awareness about the importance of physical activity in diabetes care. Participation may also differ, with a higher concentration of healthcare professionals, researchers, and individuals living with diabetes in these events.
What factors could explain the differences in race times between genders?
Several factors could influence differences in race times between genders, such as biological factors (e.g., muscle mass and aerobic capacity), experience level, and overall fitness. Environmental factors, event conditions, and participation rates could also affect these trends.
Are there any costs associated with participating in the 5K@EASD or 5K@ADA events?
No, participation in the 5K@EASD and 5K@ADA events is free and open to everyone, regardless of fitness level. These events are designed to be accessible, encouraging a wide range of participants to engage in physical activity while raising awareness about diabetes management.
Can non-conference attendees participate in these 5K events?
Yes, non-conference attendees can participate in both the 5K@EASD and 5K@ADA events. Participants can sign up online, select their own 5K route, and complete the run or walk wherever it is convenient for them. They can track their time using any method they prefer, then submit their results to the virtual results page during the designated submission window. Once the results are submitted, participants can download a finisher certificate to celebrate their achievement. These events are designed to be inclusive, allowing anyone, regardless of location or conference attendance, to join the challenge.


