
This project presents an interactive data visualization, designed to communicate key insights from our employee retention study at Salifort Motors. The presentation, accessible via Tableau Public, is intended for the company's executives and senior managers.
The visualization leverages data analysis conducted in Python as part of the Google Advanced Data Analytics Capstone Project. This project provided an opportunity to transform a complex data analysis into a clear, engaging, and professional presentation tailored to our audience's needs.
The Tableau presentation employs story points to guide the audience through the data, highlighting significant findings and insights. This approach allows for a more interactive and engaging experience, enabling viewers to explore the data and draw their own conclusions.
This project underscores the power of data visualization in communicating complex data in a clear, impactful manner. It demonstrates how Tableau can be used to transform raw data into a compelling narrative that informs strategic decision-making.
Link to Presentation on Tableau Public
An overview of a comprehensive project aimed at improving employee retention at Salifort Motors. The project utilizes data exploration, analysis, and predictive machine learning models, all implemented using Python.
Data Analysis Using Python
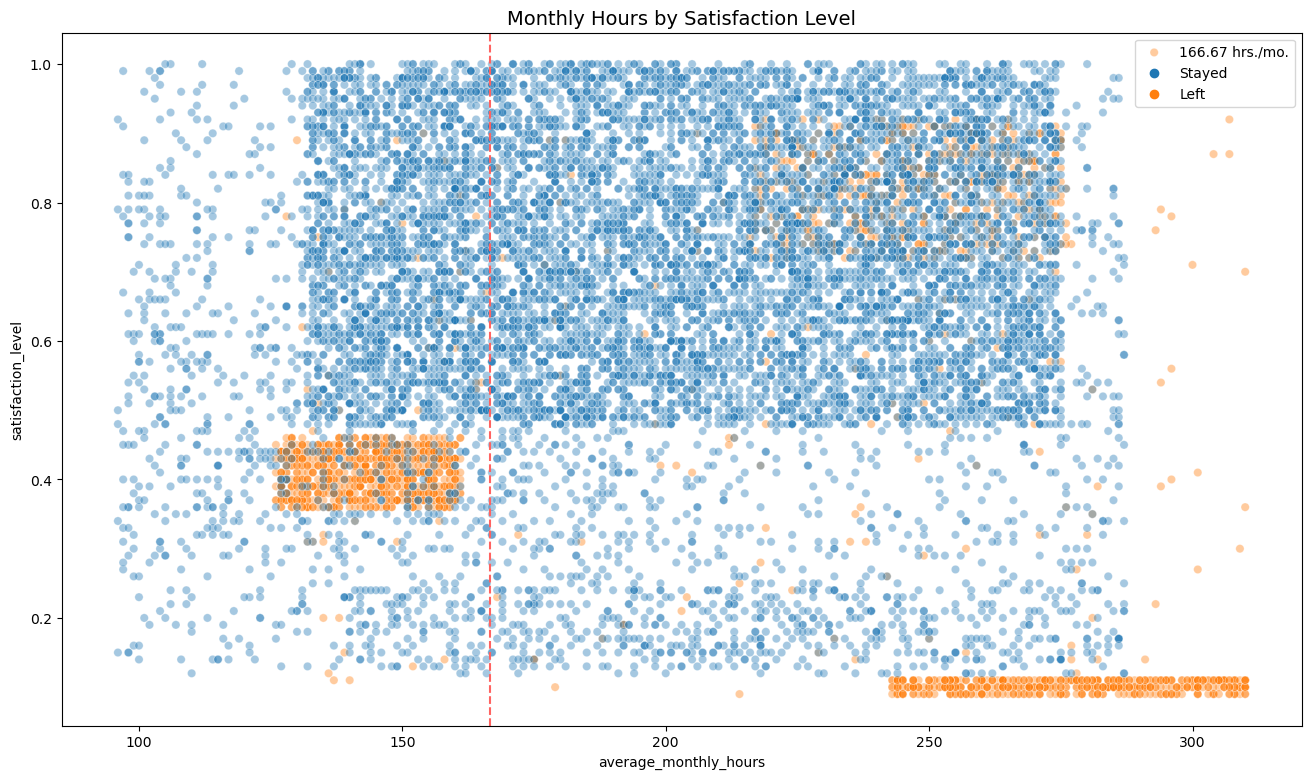
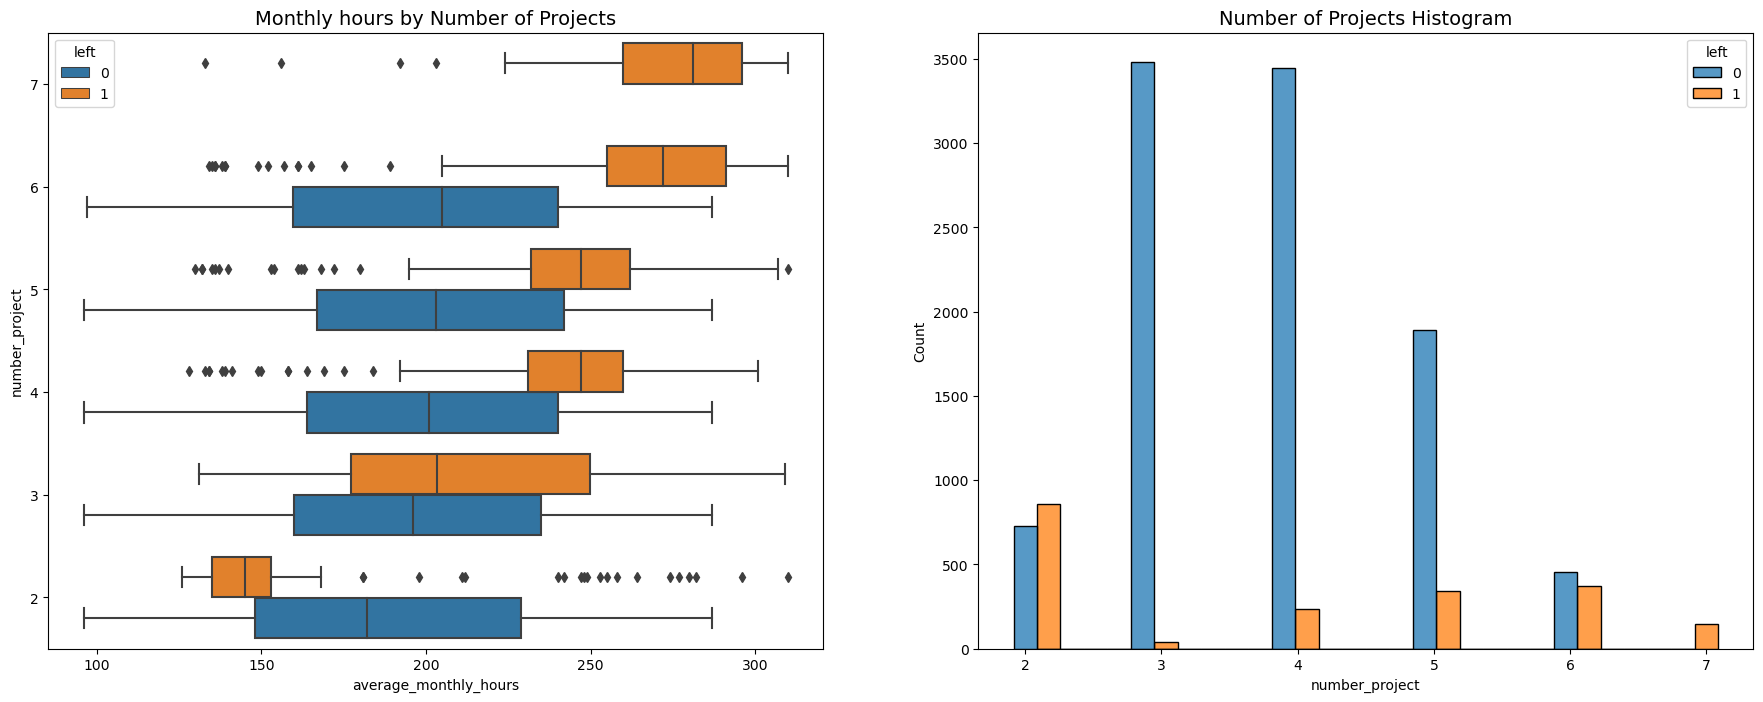
The initial phase of the project involves data exploration and analysis using Python. This process allows us to understand the underlying patterns and trends in our data, which is crucial for determining subsequent steps. We utilize Python libraries such as Seaborn and Matplotlib to create preliminary visualizations, which provide valuable insights into the data.
Project Resources on GitHub
The project repository on GitHub contains four key files:
This project demonstrates the power of data analysis and machine learning in addressing real-world challenges. By leveraging these tools, we can gain valuable insights and make informed decisions to improve employee retention at Salifort Motors.
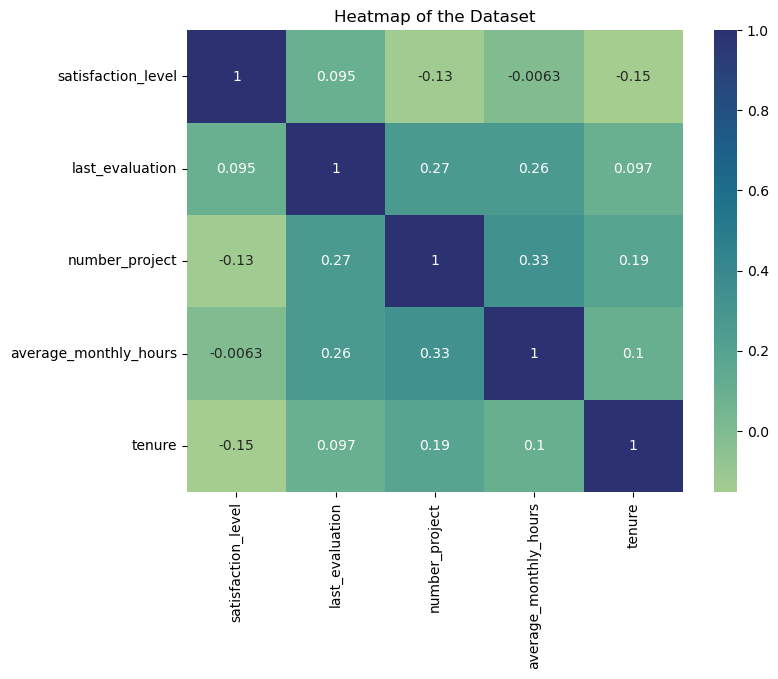
Heatmap of Logistic Regression Dataset:
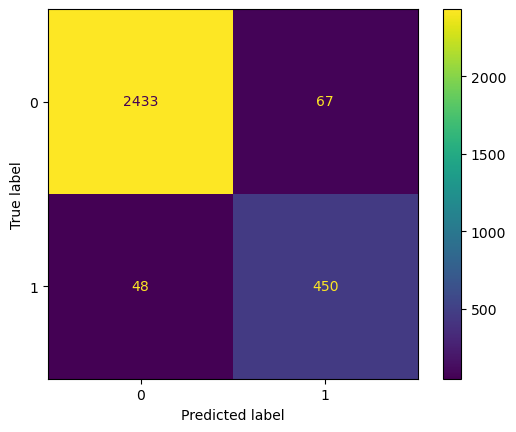
Confusion matrix for random forest machine learning model:
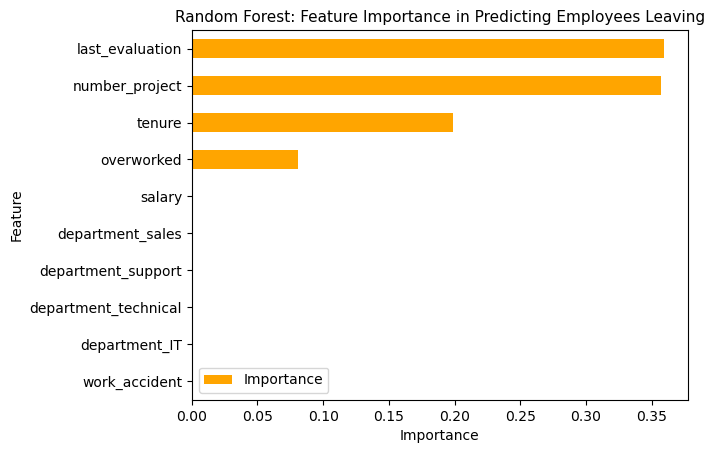
Feature importance for random forest model:
Version 2.0 - Updated 10/8/2023
An in-depth analysis of Divvy Bikeshare rentals using Python, and offering strategic recommendations for increasing membership. The project's GitHub repository contains all relevant files and resources.
Data Analysis Using Python
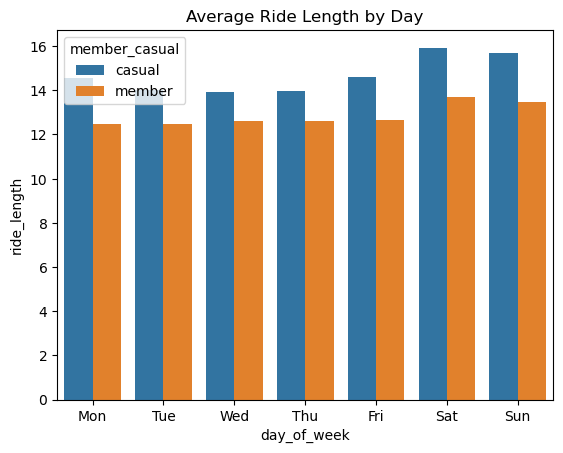
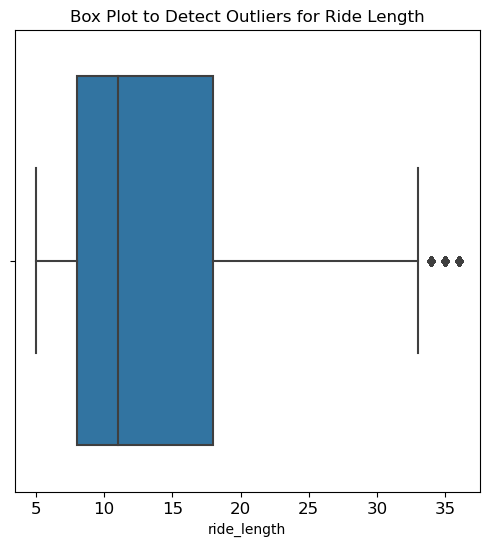
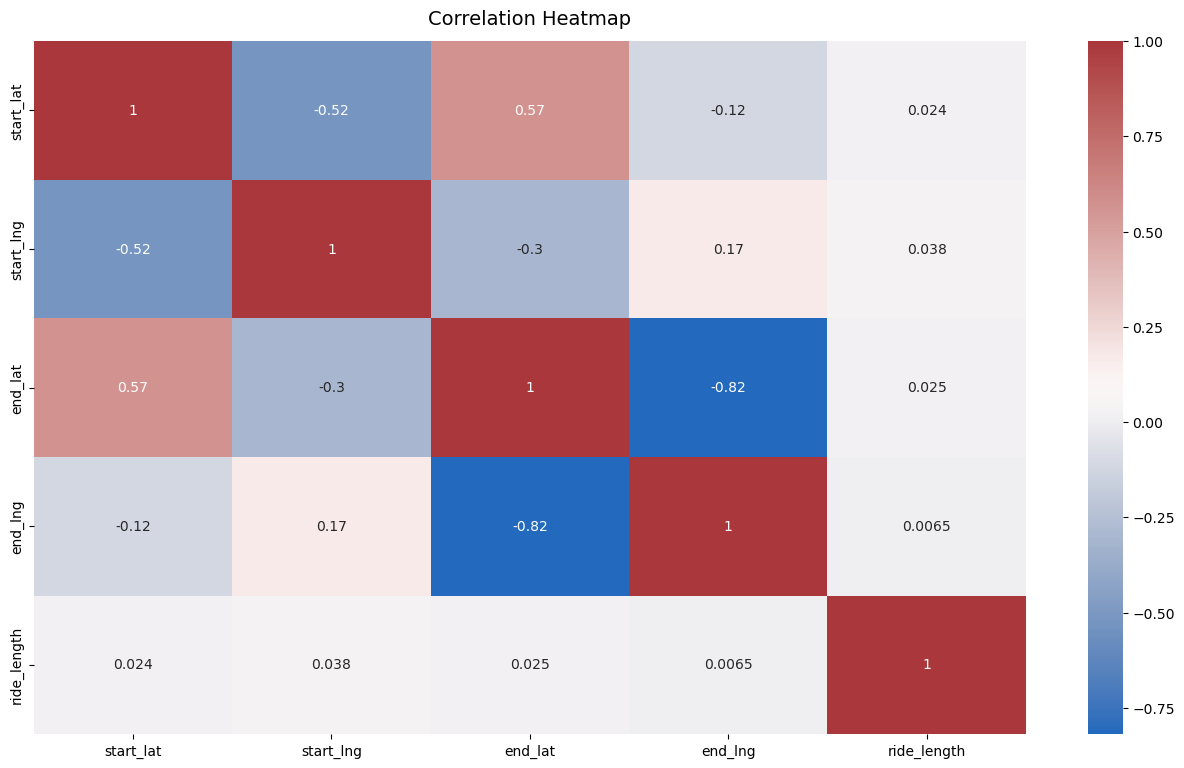
The data exploration and analysis were performed using Python, with Seaborn and Matplotlib employed for data visualization. The preliminary charts generated provide valuable insights into the patterns and trends in Divvy Bikeshare rentals.
Project Resources on GitHub
The GitHub repository for this project contains four key resources:
By exploring these resources, you can gain a deeper understanding of the data analysis process and the insights derived from the Divvy Bikeshare rentals data. These insights can inform strategies for attracting new members and enhancing the overall user experience.
Page 9 of 9