Version 2.0 - Updated 10/8/2023
An in-depth analysis of Divvy Bikeshare rentals using Python, and offering strategic recommendations for increasing membership. The project's GitHub repository contains all relevant files and resources.
Data Analysis Using Python
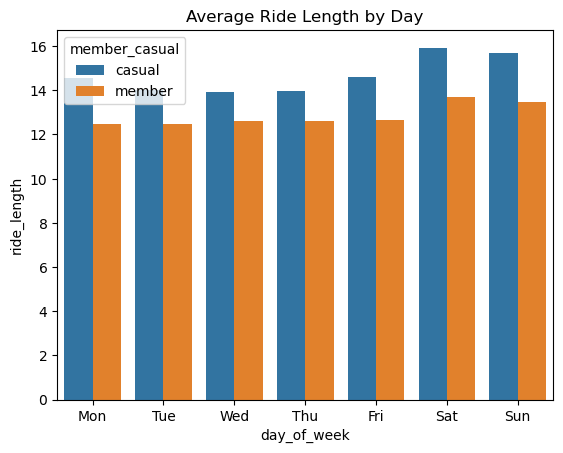
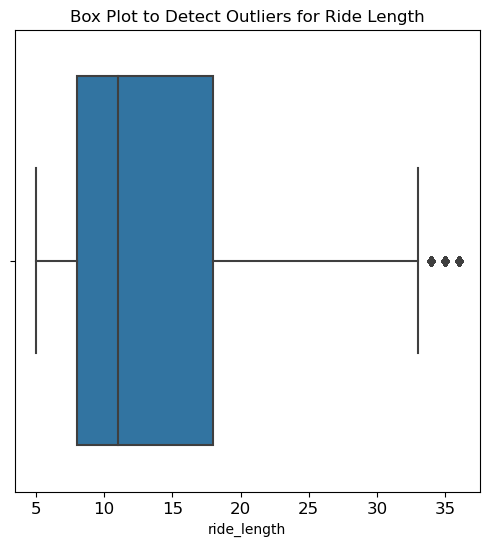
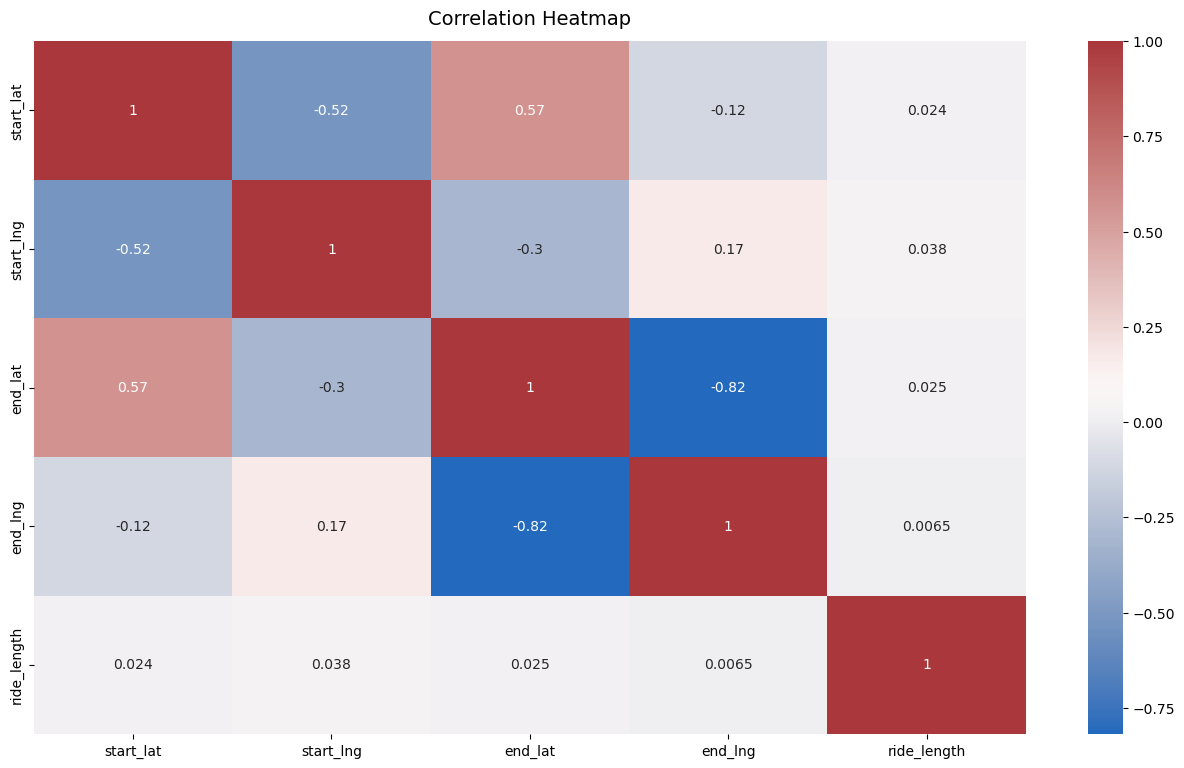
The data exploration and analysis were performed using Python, with Seaborn and Matplotlib employed for data visualization. The preliminary charts generated provide valuable insights into the patterns and trends in Divvy Bikeshare rentals.
Project Resources on GitHub
The GitHub repository for this project contains four key resources:
- A Jupyter Notebook file (.ipynb) containing the Python code used for the analysis, complete with comments and annotations for clarity.
- An internal report (in PDF format) detailing the findings of the data analysis, intended for the data analysis team.
- A presentation handout (in PDF format) summarizing the key points of the analysis.
- A link to the full presentation hosted on Tableau Public, providing a comprehensive and interactive view of the data analysis results.
By exploring these resources, you can gain a deeper understanding of the data analysis process and the insights derived from the Divvy Bikeshare rentals data. These insights can inform strategies for attracting new members and enhancing the overall user experience.