This project focuses on the utilization of a comprehensive dataset from the Centers for Disease Control and Prevention (CDC) to create interactive, color-coded visualizations that show the status of COVID-19 vaccinations across the United States. The dataset, although no longer updated, is a valuable resource for honing data cleaning skills in Python and developing interactive visualizations in Tableau.
The dataset, accessible to the public without restrictions, is a mix of aggregate, non-aggregate, and overlapping data. To ensure the accuracy and reliability of the analysis and visualization, a meticulous review and cleaning of the data are required.
Data Cleaning in Python
The data cleaning process in Python involves several steps:
- Removal of unnecessary columns. These are values that can be calculated in Tableau.
- Exclusion of rows containing aggregate or overlapping data.
- Exclusion of rows pertaining to US territories outside the 50 states.
- Creation of 'Gender' and 'Age Group' columns using values from 'Demographic_Category'.
- Removal of the 'Demographic_Category' column, which is now redundant.
- Renaming of three columns, including 'Location', which is renamed to 'State'. This allows Tableau to automatically recognize US state abbreviations as geographic data, facilitating map creation.
- Matching of state abbreviations to state names by merging the dataset with another dataset containing state names.
- Saving of the cleaned data for subsequent visualization in Tableau.
Visualization in Tableau
The cleaned data is used to create two interactive visualizations in Tableau:
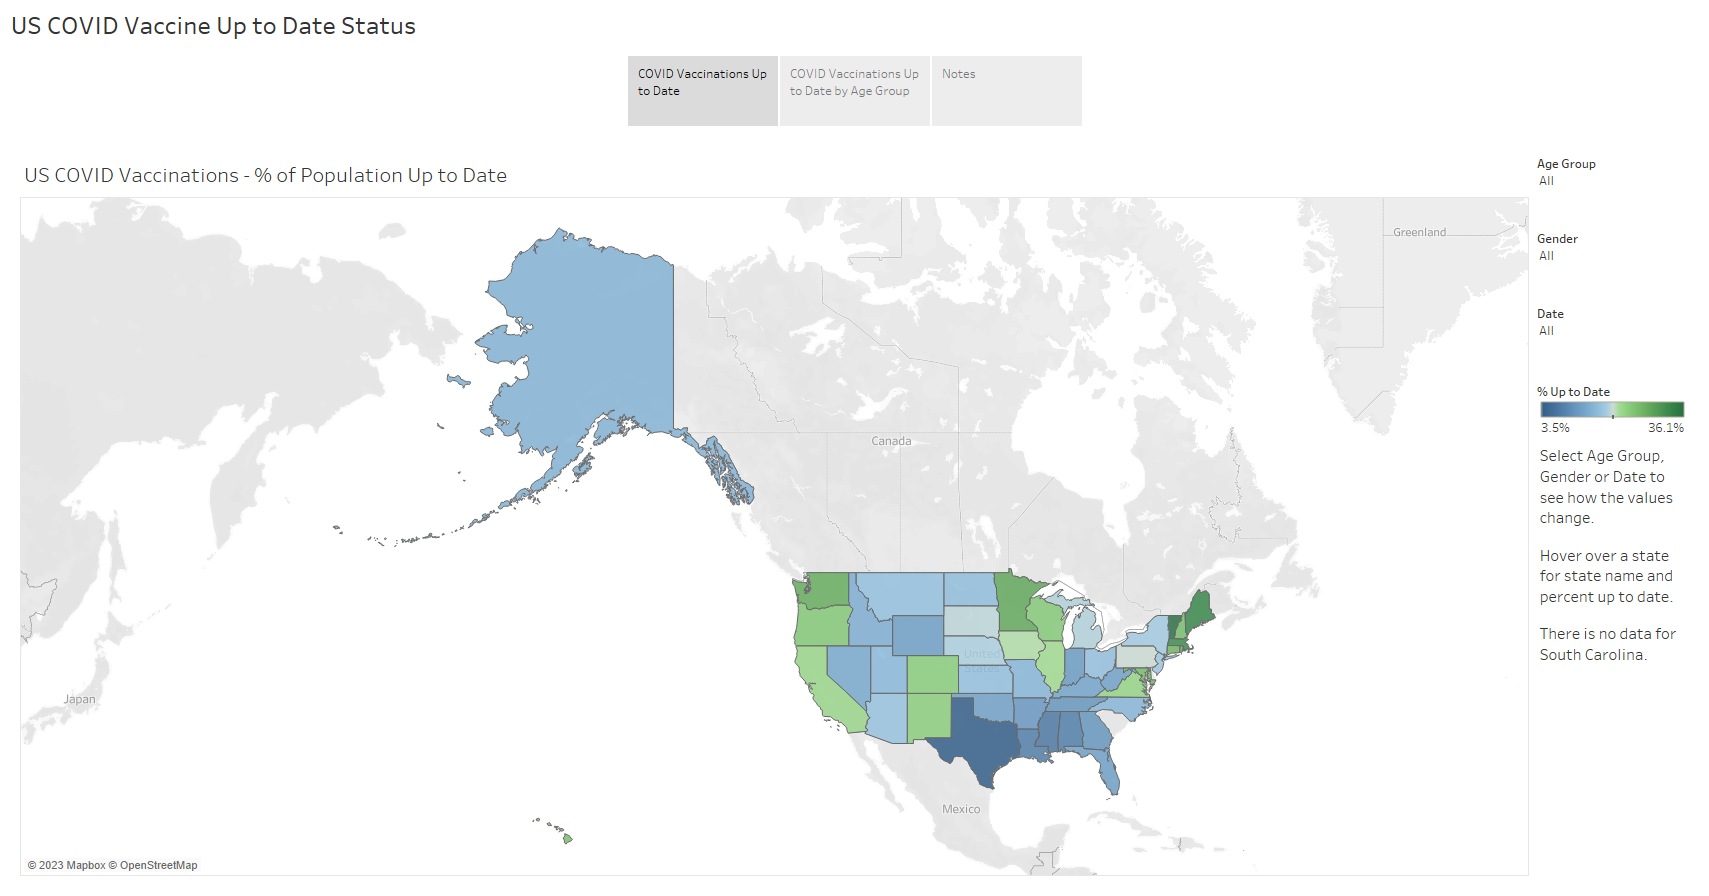
- 1. An interactive map displaying the percentage of the population up to date with COVID-19 vaccinations by state. Users can select any combination of age group, gender, and date to observe changes in values.
- An interactive bar chart showing the percentage of the population up to date with COVID-19 vaccinations by age group. Like the map, users can select any combination of age group, gender, and date to see how the values change.
- Notes about the data.
Link to visualization on Tableau Public
Data Source
Centers for Disease Control and Prevention (CDC) Public Data
COVID-19 Vaccines Up to Date Status
https://data.cdc.gov/Vaccinations/COVID-19-Vaccines-Up-to-Date-Status/9b5z-wnve/data
Published by: Centers for Disease Control and Prevention (CDC)
Public Access Level: Data asset is publicly available to all without restrictions (public)
License: Public Domain U.S. Government