The analysis of customer churn is a critical task that can significantly impact a bank's profitability and long-term success. Churn, the rate at which customers leave a bank, can be influenced by factors such as customer service quality, product offerings, and competitive dynamics within the industry.
The dataset includes a range of variables such as customer demographics, account details, and transaction history, which are necessary for understanding the patterns of customer churn.
The project involved a multi-stage process, beginning with data exploration and cleaning using Python. Python is a powerful tool for data manipulation, allowing for efficient identification and resolution of data quality issues. This step is crucial before any further analysis to ensure the integrity of the dataset.
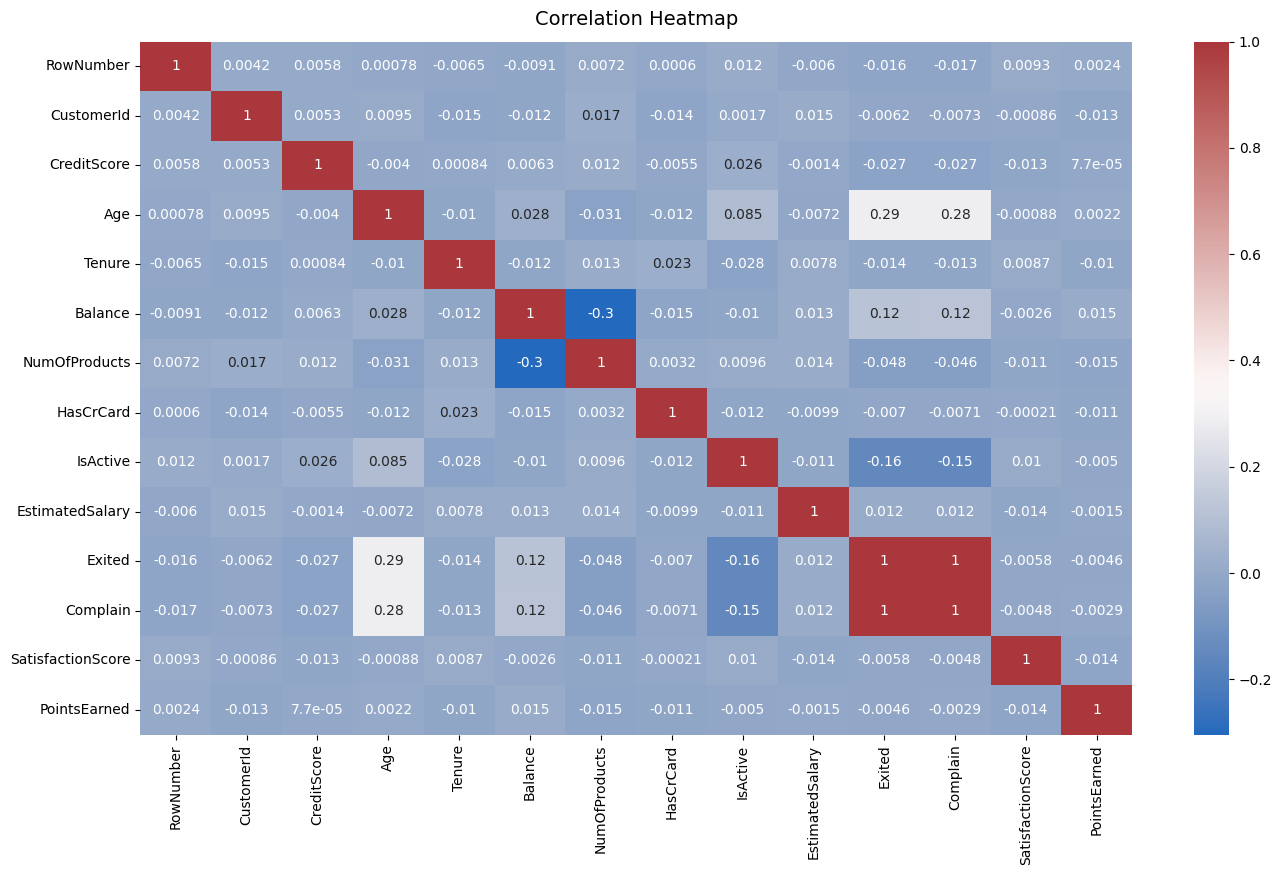
Once the data was prepared, I did a basic statistical analysis to look for anything interesting or unusual. Generating a correlation heatmap led to an important discovery: a perfect correlation (correlation of 1) between customers who complained and those who exited the bank, a finding that suggests customer complaints are a strong predictor of churn. Addressing customer grievances could be a key strategy in reducing churn rates.
Further exploration and visualization were carried out in Tableau to complement the analysis in Python. Tableau is a powerful visualization tool that can help in presenting data in an intuitive and impactful manner. The insights gained from the Python analysis, particularly the strong correlation between complaints and churn guided the creation of visualizations with Tableau.
The combination of Python for data preparation and statistical analysis, followed by Tableau for visualization, is a robust approach to understanding and addressing customer churn in banking. By utilizing these tools, banks can gain a deeper understanding of what causes customer churn and develop strategies to improve customer retention.
This bank churn analysis project underscores the importance of a thorough and methodical approach to data analysis in any project. Utilizing the strengths of both Python and Tableau provided actionable insights to reduce customer churn and improve the bank's competitive edge.
Bank Churn Analysis from https://www.kaggle.com/datasets/mathchi/churn-for-bank-customers (License - CC0: Public Domain)
Link to project files on GitHub
Link to visualizations on Tableau Public
Correlation heatmap from the data analysis in Python that revealed the strong relationship between customers who complained and those who exited the bank (variables 'Exited' and 'Complain'):