Abstract
Blood glucose monitoring (BGM) through twice daily fingerstick readings has been a fundamental part of tracking and visualizing glucose trends since my type 2 diabetes diagnosis in January 2023. While I now use a continuous glucose monitor (CGM) for continuous tracking, BGM remains an important data source for structured trend analysis, treatment evaluation, and accuracy validation. This project focuses on refining BGM visualizations to align with standardized glucose reporting formats, improving readability and insight into key glucose metrics. The updated approach enhances trend analysis while maintaining the value of fingerstick readings as a reliable reference point.
Key Points
- BGM remains a valuable tool – Despite using a CGM, twice-daily fingerstick readings provide structured data that support trend analysis and treatment evaluation.
- Clear trend visualization – Updated BGM visualizations improve formatting consistency, making it easier to track monthly and daily glucose trends.
- Treatment impact assessment – Data comparisons show significant reductions in average blood glucose and A1c following treatment adjustments.
- Standardized reporting formats – The visualizations now follow structured layouts similar to CGM reports, improving clarity and usability.
- BGM as a complementary data source – Fingerstick readings help verify CGM data, track fasting and postprandial glucose, and provide long-term continuity in data analysis.
Introduction
Since my diagnosis with type 2 diabetes in January 2023, I have used blood glucose data to monitor my progress and evaluate treatment effectiveness. Initially, I relied entirely on blood glucose monitor (BGM) readings, taken through twice daily fingersticks. While I now use a continuous glucose monitor (CGM) for around-the-clock glucose tracking, I continue to take BGM readings because they provide additional insights and help validate CGM data.
This project focuses on visualizing BGM data to track trends over time, highlighting how structured fingerstick readings remain a valuable tool for understanding glucose control.
Why I Created This Project
- Track and Visualize Progress – To create clear, structured visualizations of blood glucose trends over time.
- Assess Treatment Effectiveness – To measure the impact of different treatment phases on blood glucose levels.
- Refine Data Analysis Skills – To develop a standardized approach for working with BGM data in Tableau.
Key Insights from My BGM Data
This analysis includes data from January 2023 onward, capturing glucose trends by day, month, and treatment phase. Key observations include:
- Monthly Averages – Blood glucose levels steadily declined after an initial peak in early 2023, reflecting treatment effectiveness.
- Impact of Treatment Changes – Comparing periods with and without Mounjaro, the data shows a clear reduction in both average blood glucose and A1c.
- Stability and Variability – BGM readings provide a structured view of glucose changes, making it easier to compare trends over time.
How the Data is Analyzed
To ensure consistency across all visualizations, I use a Level of Detail (LOD) expression in Tableau that references the most recent date in the dataset. This approach keeps visualizations accurate and aligned, whether viewed locally or shared.
Automating Data Conversion for Visualization
I developed a Python program to convert data from an Excel spreadsheet, optimized for data entry, into a CSV file suitable for creating visualizations in Tableau.
The spreadsheet uses conditional formatting, which triggers a warning in Python. The following code suppresses this warning:
# Suppress the warning about conditional formatting
warnings.filterwarnings("ignore", category=UserWarning, module='openpyxl')
The NumPy library's 'select' function allows easy specification of column values based on conditions. When setting values based on dates, order the dates from newest to oldest. This ensures correct value assignment. Use the day before each value change to simplify the conditions (greater than instead of greater than or equal to).
# Create a column for Treatment
df3['Date'] = pd.to_datetime(df3['Date'])

conditions = [
    (df3['Date'] > '2025-02-25'),
    (df3['Date'] > '2024-06-18'),
    (df3['Date'] > '2024-01-30'),
    (df3['Date'] > '2023-07-18'),
    (df3['Date'] > '2023-02-28'),
    (df3['Date'] > '2023-01-31')
]

choices = [
    'Mounjaro 15',
    'Mounjaro 12.5',
    'Mounjaro 10',
    'Mounjaro 7.5',
    'Mounjaro 5',
    'Mounjaro 2.5'
]

df3['Treatment'] = np.select(conditions, choices, default='Untreated')Note: 'Value AM' , 'Value PM' and 'Value EX' columns tend to load as 'float64', especially if they contain null values. To correct this, let the values load as 'float64' and convert them to 'int64'.
Link to Python Code on GitHub (Jupyter Notebook)
Automating Data Conversion for Visualization
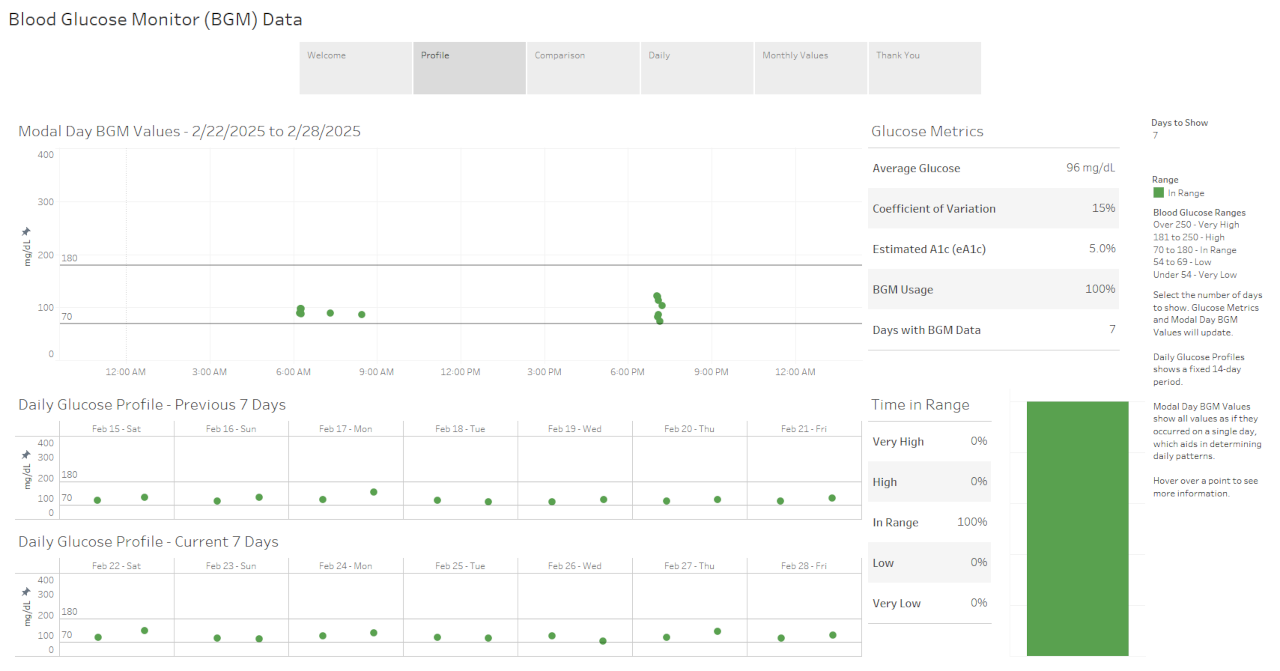
I’ve refined the visualizations to better align with standard glucose reporting formats. While these charts focus on BGM data, they follow structured layouts similar to CGM reports to improve clarity and usability.
What’s New in the Visualizations?
- More Consistent Formatting – Updated layouts improve readability and standardization.
- Expanded Insights – Time-in-range metrics and standardized glucose measures enhance trend analysis.
- Refined Data Views – Daily and monthly reports make it easier to track patterns over time.
Why Continue with Twice-Daily Fingersticks?
Despite using a CGM, I continue with BGM readings because they offer distinct benefits:
- Fasting and Postprandial Tracking – BGM provides structured readings at specific times, making it ideal for measuring these key glucose points.
- Baseline and Accuracy Checks – Fingerstick readings help verify CGM trends and highlight potential discrepancies.
- Long-Term Comparisons – Since my dataset began with BGM readings, maintaining this data ensures continuity for long-term trend analysis.
Final Thoughts
BGM data remains a valuable tool for tracking glucose trends, even with CGM providing continuous data. By standardizing and refining these visualizations, I can better assess progress and treatment effectiveness.


