A data-driven look at how well continuous glucose monitor (CGM) readings align with blood glucose meter (BGM) readings—and what it reveals about device performance and sensor placement.
Abstract
Explore how Python and Tableau can be used to evaluate the alignment between continuous glucose monitor (CGM) and blood glucose meter (BGM) readings. By pairing readings within a 15-minute window and analyzing percent differences over time and by sensor location, the project identifies patterns in device performance and helps validate sensor placement.
Key Points
- Pairing Logic: Python is used to match BGM readings with the nearest CGM reading within a 15-minute window to account for physiological lag.
- Sensor Location Handling: merge_asof() enables accurate assignment of CGM sensor location data without requiring exact timestamp matches.
- Data Scope: The analysis uses cleaned BGM and CGM datasets, covering the most recent 90 days.
- Visualization Design: Tableau dashboards display daily trends, alignment by location, and AM/PM breakdowns, with parameters and filters to support interaction.
- Application: The workflow highlights how differences in alignment can point to sensor performance issues, placement variability, or expected physiological lag.
Overview
This project combines real-world data, Python, and Tableau to explore how well CGM readings align with BGM readings. By matching each BGM reading with a nearby CGM reading in time and calculating the percent difference, the program supports daily tracking, site evaluation, and sensor performance monitoring.
Project Purpose
While it's well understood that CGMs and BGMs measure different compartments (interstitial fluid vs. blood) and may not always match, this project focuses on:
- Detecting alignment patterns over time and by sensor placement
- Evaluating whether deviations are expected or problematic
- Providing an efficient, repeatable method for data review
Python Workflow
The Python program serves two purposes:
- Pairing BGM and CGM readings
- Each BGM value is paired with the nearest CGM reading within a 15-minute window.
- This window accounts for CGM lag (5–15 minutes is typical) while ensuring a meaningful comparison.
- Calculating and storing key metrics
- For each pair, the code calculates the difference, absolute difference, percent difference, and binned percent ranges (10% increments).
- While these intermediate values aren’t used in the Tableau visualizations, they are available for QA checks or further analysis.
- Handling sensor location changes
- Uses merge_asof() for fuzzy timestamp joins with the CGM sensor location data.
- Without this, location change events can be assigned to the wrong day, often appearing as if they occurred the following morning.
- Data scope
- The dataset is limited to the past 90 days to match the retention period of the CGM data source.
- BGM and CGM readings are pre-cleaned before processing.
Tableau Visualizations
Daily Alignment (Rolling 7 Days)
-
- Displays AM and PM percent differences by day.
- Uses a parameter to select which week to display (up to 12 weeks back).
- Relies on a calculated field (Which Week) to define the appropriate date range based on parameter input.
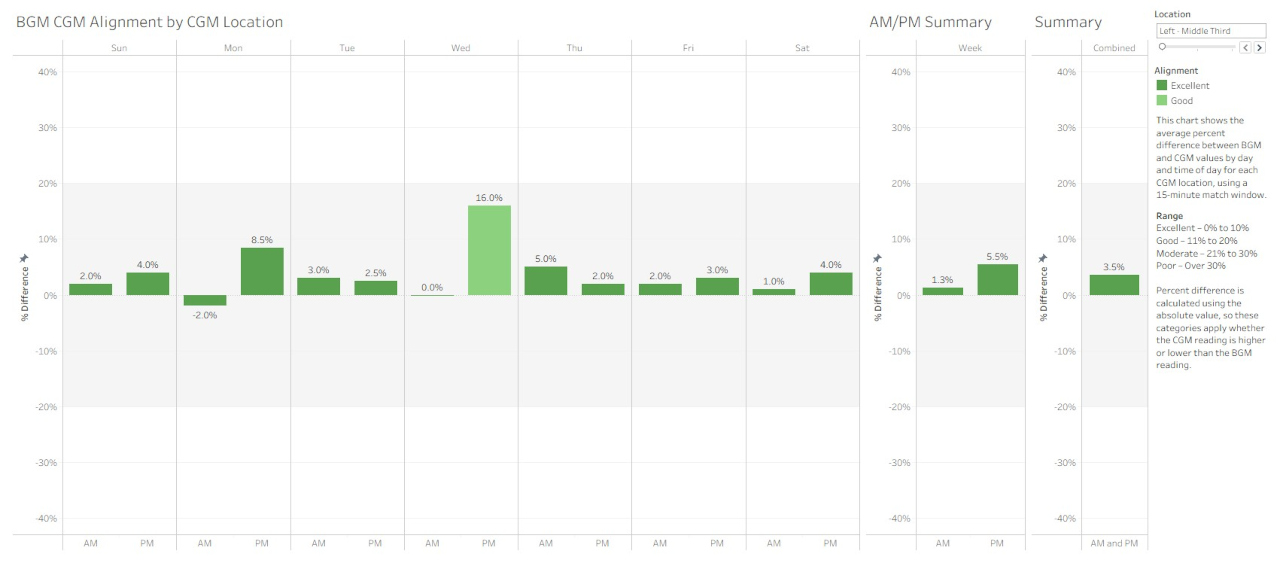
Alignment by Sensor Location
-
- Aggregates average alignment by day of week and by CGM location.
- Offers separate views for:
- AM and PM readings
- Combined summaries
- Includes filters to isolate specific sensor placement sites.
Custom Week Count Handling
To correctly display the number of weeks each summary covers:
-
-
- Count Days: COUNTD([Date])
- Count Weeks: CEILING([Count Days] / 7)
-
These calculated fields are applied in the BGM-CGM Alignment by CGM Location visualizations to display the number of weeks in the tooltips:
-
-
- Count Days is used in the CGM Location by Day of Week view.
- Count Weeks is used in the AM/PM Summary and Overall Summary views. This prevents raw day counts from being misinterpreted as weeks (e.g., avoiding “46 days” appearing as “46 weeks”) and ensures week-based aggregation is correct.
-
Key Insights
- CGMs often align well with BGM values, unless the placement site is suboptimal or blood glucose level is changing rapidly.
- Some locations yield consistently tighter alignment than others.
- Poor alignment or unexpected variation may indicate sensor lag, placement issues, or natural variability during glucose transitions.
Why This Matters for Data Analysts
This project illustrates practical applications of:
- Fuzzy joins and time-based pairing logic in real-world data
- Combining Python and Tableau for a full-stack analytics workflow
- Rolling and parameterized filters to support longitudinal analysis
- Custom aggregation logic to control granularity in visualizations
For analysts working in healthcare, wearables, or IoT datasets, this approach is adaptable and highly relevant.
For more on the patient-centered side of this approach, see the companion article at:
https://jcst2d.com/index.php/articles/how-well-do-my-cgm-and-bgm-readings-match
Merge Using merge_asof
# Perform an asof merge to assign the most recent CGM location
df5 = pd.merge_asof(
    df3,
    df4[['DateTime', 'Location']],
    left_on='BGM DateTime',
    right_on='DateTime',
    direction='backward'
)
This code merges two DataFrames (df3 and a subset of df4) so that each row in df3 gets the most recent CGM location from df4 whose timestamp is at or before the BGM DateTime.
Key points:
- pd.merge_asof does a nearest-key match based on time, not an exact match.
- left_on='BGM DateTime' and right_on='DateTime' tell pandas which time columns to align on.
- direction='backward' ensures it picks the most recent past time, not a future one.
- Only DateTime and Location are taken from df4.
It’s essentially a time-aware join to map each BGM reading to the last known CGM location.
Links


