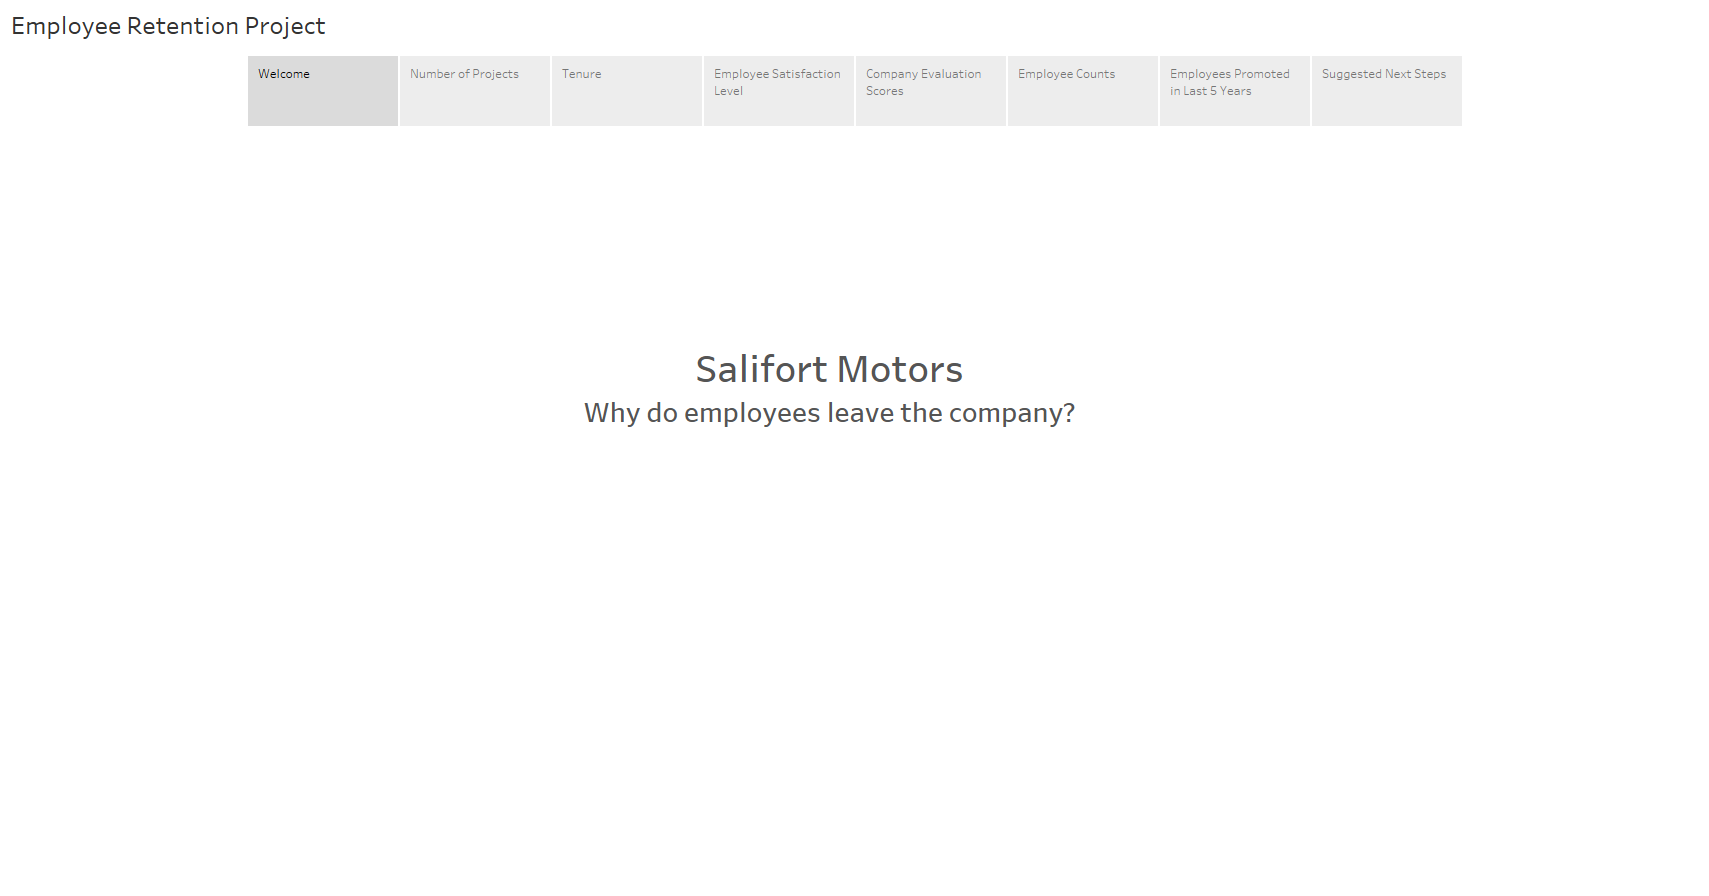
This project presents an interactive data visualization, designed to communicate key insights from our employee retention study at Salifort Motors. The presentation, accessible via Tableau Public, is intended for the company's executives and senior managers.
The visualization leverages data analysis conducted in Python as part of the Google Advanced Data Analytics Capstone Project. This project provided an opportunity to transform a complex data analysis into a clear, engaging, and professional presentation tailored to our audience's needs.
The Tableau presentation employs story points to guide the audience through the data, highlighting significant findings and insights. This approach allows for a more interactive and engaging experience, enabling viewers to explore the data and draw their own conclusions.
This project underscores the power of data visualization in communicating complex data in a clear, impactful manner. It demonstrates how Tableau can be used to transform raw data into a compelling narrative that informs strategic decision-making.
Link to Presentation on Tableau Public


