
Revisiting two race results projects to improve data gathering, cleaning, and validation while creating a more consistent foundation for analysis.
Summary
Revisiting the 5K@ADA and 5K@EASD race results projects provided an opportunity to improve how data is gathered, cleaned, validated, and prepared for visualization.
The original Selenium-based gathering process eventually stopped working, while changes in the available data columns complicated historical comparisons. The updated process retrieves structured JSON data directly and introduces additional checks for completeness and consistency.
With both races using the same columns in 2026, the results can now be cleaned independently, combined into a consistent dataset, and compared in Tableau.
The workflow deliberately retains separate programs and validation checkpoints. The objective is not simply greater automation, but a more reliable, transparent, and maintainable data pipeline.
Key Points
- Structured data retrieval reduces dependence on webpage navigation. Direct JSON requests replace Selenium-based browser interaction and HTML parsing, simplifying the gathering process.
- Data completeness requires explicit validation. Checking expected record counts, pagination, and response consistency helps identify incomplete or unexpected results before cleaning begins.
- Careful data cleaning protects analytical accuracy. Duplicate detection, controlled missing-value handling, and standardized gender and age-group values improve the consistency of the resulting datasets.
- Consistent data structures simplify comparison. Matching columns in the 2026 results allow the 5K@ADA and 5K@EASD datasets to be combined and analyzed through a common Tableau visualization.
- Separate processing stages improve maintainability. Keeping gathering, cleaning, and combining in distinct programs creates opportunities to inspect the data, isolate problems, and correct issues without troubleshooting a single large workflow.
Revisiting the Race Results Projects
Over the past several years, I've used Python and Tableau to gather, clean, and visualize results from the 5K@ADA and 5K@EASD virtual races. These projects have allowed me to explore participation patterns, finishing times, and differences among participants from countries around the world.
My earlier projects focused primarily on historical trends across multiple years. I used Python with Selenium and BeautifulSoup to retrieve results from the race websites, pandas to clean and prepare the datasets, and Tableau to create interactive visualizations.
Over time, however, the projects became more difficult to maintain.
One challenge was that the available columns varied between years, requiring additional adjustments before I could compare the results.
Eventually, the Selenium-based data gathering process stopped working. Without a reliable way to retrieve new results, continuing the analysis became impractical.
When I recently revisited the projects, I examined how the results were being provided and tested a different approach to retrieving them. That allowed me to restore the data gathering process.
The 2026 results offered another advantage: both races use the same columns. This makes it easier to standardize, combine, and compare the results without reconciling different source layouts.
Rather than simply restoring the original programs, I used the opportunity to improve the overall workflow.
My objective was a process that would be more reliable, easier to validate, and simpler to maintain, with problems that could be traced to individual stages.
Designing a More Manageable Data Pipeline
I decided to keep data gathering, cleaning, and combining as separate operations.
I considered combining data gathering and cleaning, or even running the entire workflow through a single Python program.
A single program would reduce the number of files to run, but it could make troubleshooting more difficult. If something unexpected appeared in the final visualization, I might have to trace the issue through a much larger program to find its source.
Instead, the workflow remains divided into distinct stages:
- Gather the data. Retrieve the race results, validate the download, and save the original dataset.
- Clean the data. Identify duplicates, handle missing values, standardize fields, and save the cleaned dataset.
- Combine the data. Bring the cleaned results from both races into a common dataset and prepare them for visualization.
- Visualize the results. Use Tableau to explore participation and performance across the two races.
I gather and clean the results independently for each race. Once I've checked both cleaned datasets, I combine them for analysis.
This approach introduces deliberate checkpoints.
After downloading the results, I can examine the data before cleaning begins. After cleaning, I can verify the output before combining it with the other race's results.
The programs automate the repetitive work while preserving opportunities to review the data.
For this project, control over each stage matters more than completing the entire workflow in one run.
Improving the Data Gathering Process
Moving Beyond Selenium-Based Retrieval
The original gathering programs used Selenium to control a web browser and BeautifulSoup to extract records from HTML tables on the race websites.
They navigated through pages of results, collected the displayed records, and saved them to CSV files for further processing.
The approach worked, but it depended on the webpages' structure and behavior.
For example, the 5K@EASD program located the Next button, clicked it, waited for the next page to load, and extracted the results from the updated HTML table.
If the page structure or navigation behavior changed, the program could stop working.
There was also a potential ambiguity in how pagination ended. A missing Next button or a timeout could mean that the program had reached the last page, but it could also mean that the page hadn't loaded correctly.
That distinction matters when the goal is a complete dataset.
A program that finishes without an error hasn't necessarily retrieved every available record.
Retrieving Structured Data Directly
The updated 5K@EASD program uses a different approach.
Instead of controlling a browser, it retrieves structured JSON data from requests to the RunSignup results service.
It uses Python's standard-library modules urllib and json to request and process the results.
This removes the need to launch a browser, locate webpage elements, click pagination controls, or parse an HTML table.
The updated program requests results in pages of up to 1,000 records and uses the information returned by the service to determine how many results should be available.
This simplifies retrieval, but the more significant improvement is how the program validates the downloaded results.
Verifying Data Completeness
The updated program performs several checks while downloading results.
It verifies that the response contains the expected structure and belongs to the requested result set. It also checks that the number of records returned on each page matches the expected count.
Additional checks identify repeated pages, duplicate result identifiers when those identifiers are supplied, and unexpected changes in the reported number of results.
If the headings or total number of records change during retrieval, the program stops rather than continuing with a potentially inconsistent dataset.
The program also includes timeout handling and retries for certain temporary connection and server errors.
These checks reduce the risk of collecting an incomplete dataset without clearly identifying the problem.
if len(rows) != expected_on_page:
    raise RuntimeError(
        f"Page {page}: expected {expected_on_page} rows, "
        f"received {len(rows)}."
    )
The distinction is important.
The original program collected records from the pages it could access. The updated program also checks whether the collected records match the totals reported by the results service.
These checks provide greater confidence in the downloaded data before cleaning begins.
I load the results into a pandas DataFrame so I can inspect the records, columns, and data types before saving the CSV file.
The CSV then becomes the input to the separate cleaning program.
Improving the Data Cleaning Process
Reliable retrieval is only one part of preparing data for analysis.
The downloaded results also need checks for duplicates, missing information, and inconsistent values.
The original cleaning programs performed several of these tasks. The updated programs handle identifiers, missing values, and category standardization more explicitly.
Identifying and Removing Duplicate Records
The earlier 5K@EASD cleaning program identified duplicates by comparing complete rows.
The updated program begins by checking duplicate bib numbers.
Bib numbers provide a more targeted way to identify potentially repeated participant records than comparing every column.
After removing duplicate bib numbers, the program performs an additional check for fully duplicated rows.
The bib number is useful during cleaning, but it isn't needed in the final visualization dataset. It's removed before the cleaned results are exported.
A field can be useful for validation without needing to appear in the final analytical dataset.
Handling Missing Values Without Losing Valid Data
Another improvement involves the interpretation of missing values.
By default, pandas recognizes several text values as missing data. That behavior is usually helpful, but it can cause problems when a legitimate value matches one of those indicators.
One example is the two-letter country code NA, which represents Namibia.
Without special handling, pandas may interpret NA as a missing value rather than a country code.
The updated programs address this by disabling pandas' default missing-value interpretation and specifying which values should count as missing.
For example:
custom_na_values = ['N/A', 'NaN', 'null', '']When loading the data, the program uses this list with keep_default_na=False.
This preserves the valid country code while still recognizing the missing-value markers defined for the project.
It's a small change that shows how default data-processing behavior can affect analytical accuracy.
Standardizing Gender and Age Groups
The updated cleaning process also standardizes gender and age-group values.
Gender values represented by F and M are converted to Female and Male. Missing values and values represented by X are categorized as Unknown in the current cleaning program.
Age-group labels are also standardized.
For example, a source value such as M3034 or F3034 can be converted to 30-34, removing the gender prefix while retaining the age range.
The resulting age-group field is consistent across both races.
After standardization, the current program excludes records where either gender or age group is Unknown.
This is an analytical decision, not just a technical cleaning step. It ensures that retained records have defined values for both categories, but it also excludes some participants from the final analysis.
The number of excluded records therefore deserves review during validation.
Preparing a Consistent Output
Once the cleaning operations are complete, the program organizes the data into a consistent set of columns:
- Race
- Year
- Country Code
- Age Group
- Time
- Gender
The results are sorted and saved to a separate CSV file for visualization.
With this common structure, I can combine the two datasets without additional transformations to reconcile different column names or layouts.
The separate cleaning programs also remain easier to maintain if the source data for either race changes in the future.
Combining the Results for Analysis
Because the cleaned 2026 datasets share the same columns, combining them is relatively straightforward.
A separate Python program loads the cleaned 5K@ADA and 5K@EASD CSV files into pandas DataFrames.
Before combining them, the program displays their structure and missing-value information for review.
The DataFrames are then combined using pd.concat().
Because the cleaned datasets include fields identifying the race and year, their records can coexist in a single dataset while remaining distinguishable during analysis.
Converting Finishing Times for Tableau
One additional transformation is needed for finishing times.
The cleaned CSV files contain finishing times in hours, minutes, and seconds. The combining program converts them into numeric fractions of a day for calculations and formatting in Tableau.
df2['Time'] = (
    pd.to_timedelta(df2['Time']).dt.total_seconds() / 86400
)
The combined dataset is then exported to an Excel workbook with a worksheet named Results.
That workbook becomes the source for the Tableau visualizations.
Keeping this step separate provides another checkpoint: I can inspect the combined dataset and verify that both races are represented before opening it in Tableau.
Visualizing the Combined Race Results
The final stage is to explore the results using Tableau.
Because both races use the same data structure, Tableau can compare their results within a shared set of views.
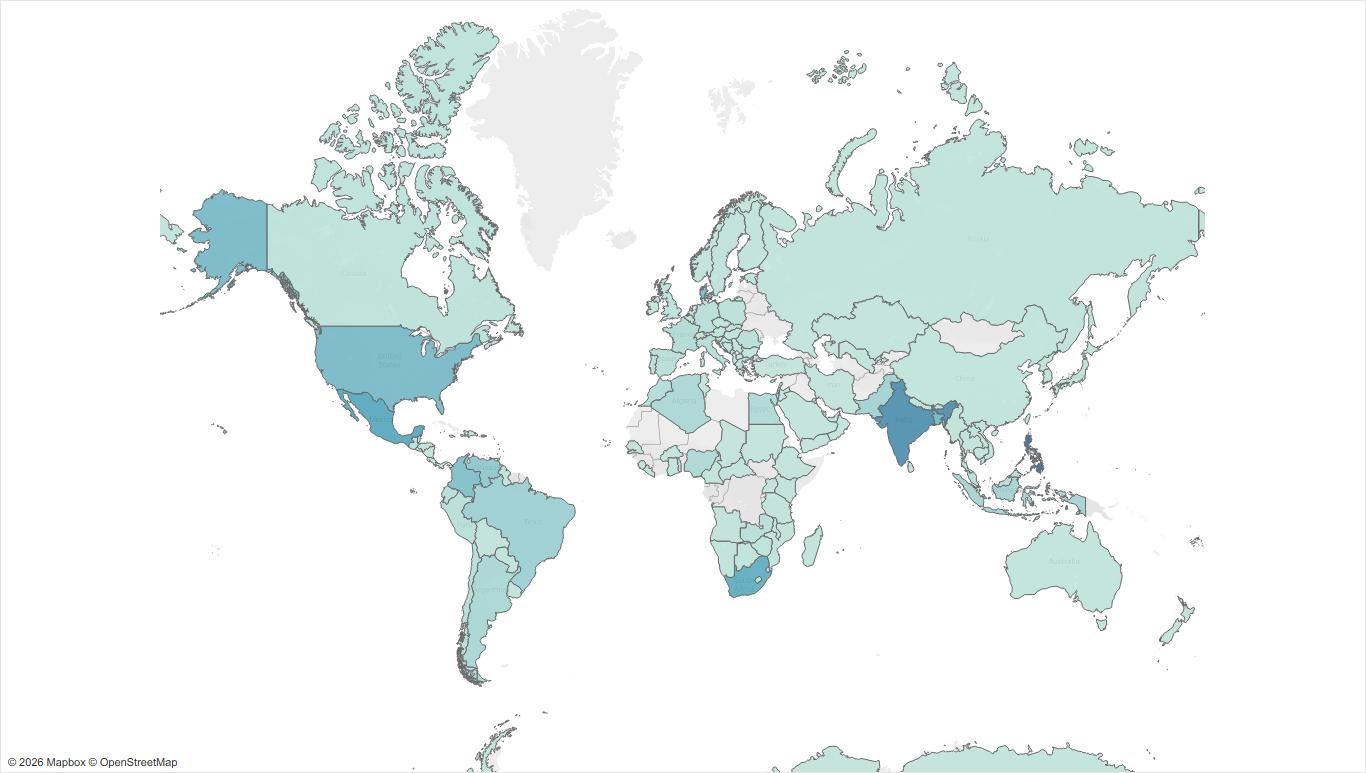
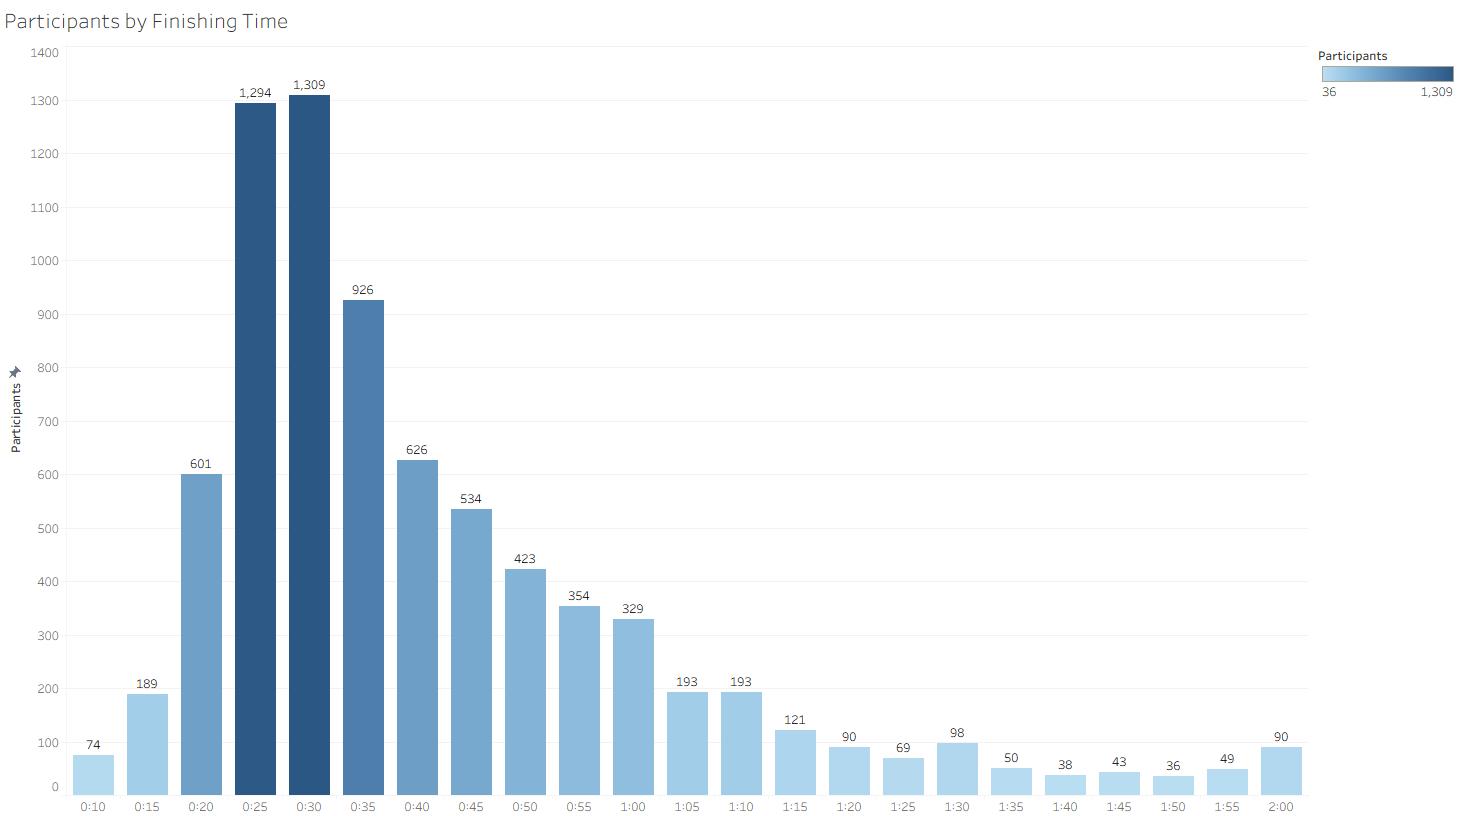
The Tableau project includes views of participation by country, the top 15 participating countries, age-group distributions, finishing-time measures, and finishing-time distributions.
Interactive controls allow the viewer to explore different subsets of the results.
Making Finishing-Time Measures More Flexible
I also refined how Tableau calculates and displays finishing-time measures.
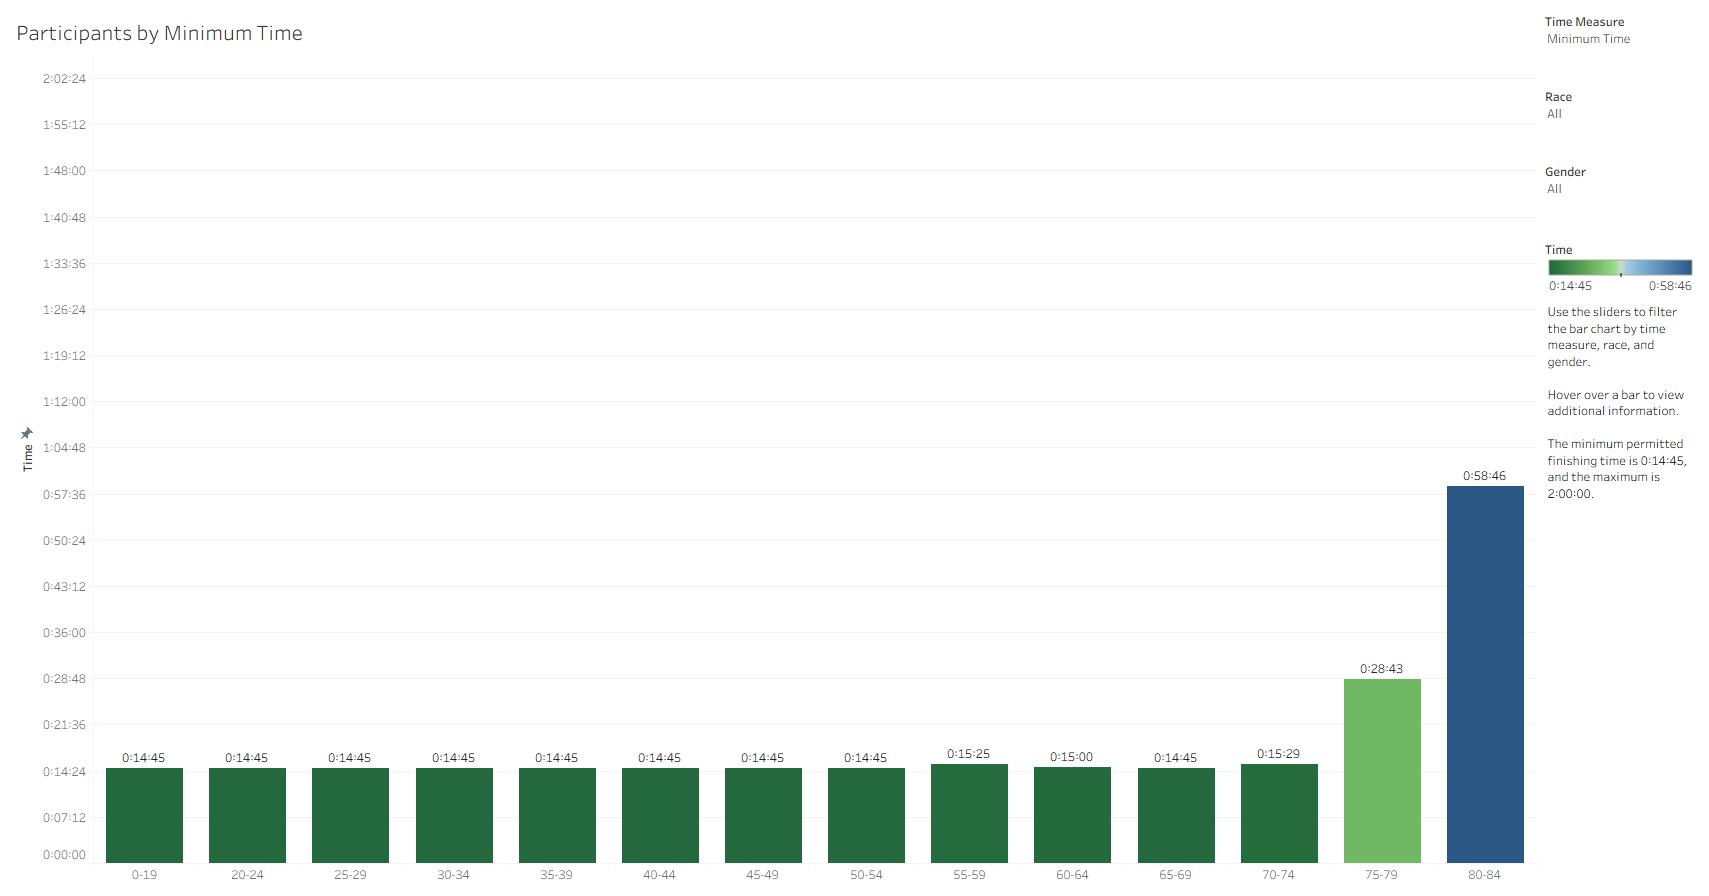
Instead of building a separate view for each measure, I defined calculated fields for minimum, average, median, and maximum finishing times.
A parameter allows the viewer to select which measure to display.
The calculated field uses a CASE statement to return the appropriate measure based on the selected parameter value.
This makes it possible to change the measure displayed in a visualization without rebuilding the chart.
I can reuse those calculated fields in tooltips and other worksheets, making the Tableau project easier to maintain.
The overall objective is to give viewers multiple ways to explore the results without requiring them to understand how the data was collected or prepared.
The Python workflow handles the gathering, cleaning, and standardization. Tableau provides the interactive environment for analyzing the resulting dataset.
Lessons Learned: Automation and Validation Work Together
Revisiting these projects reinforced several lessons about maintaining recurring data workflows.
First, an approach that works today may need to change when an external data source changes.
The original Selenium-based gathering programs served their purpose, but changes to the way results were provided eventually made them impractical. Moving to structured data requests eliminated the dependency on webpage navigation while providing an opportunity to introduce stronger validation.
Second, a program completing successfully doesn't necessarily mean its dataset is complete or correct.
Checking record counts, detecting duplicates, examining missing values, and verifying the structure of downloaded results all help identify problems before they affect the analysis.
Third, combining every operation into one automated program isn't necessarily the best design.
For these projects, separate gathering, cleaning, and combining programs make it easier to isolate problems and examine the data at critical points.
If a future change affects one race's results, I can investigate the relevant gathering or cleaning program without having to trace the problem through the entire workflow.
Finally, consistent data structures make comparisons easier.
The matching columns in the 2026 results simplify the process of combining the two races and support a common set of Tableau visualizations.
The improvements aren't simply about replacing older Python code with newer code. They're about creating a workflow that is easier to understand, validate, troubleshoot, and maintain.
For recurring data projects, that balance between automation and oversight can be more valuable than eliminating every manual checkpoint.
Related Work
Links to Race Sites
For more information about the races, including participation and registration, visit their official websites.