
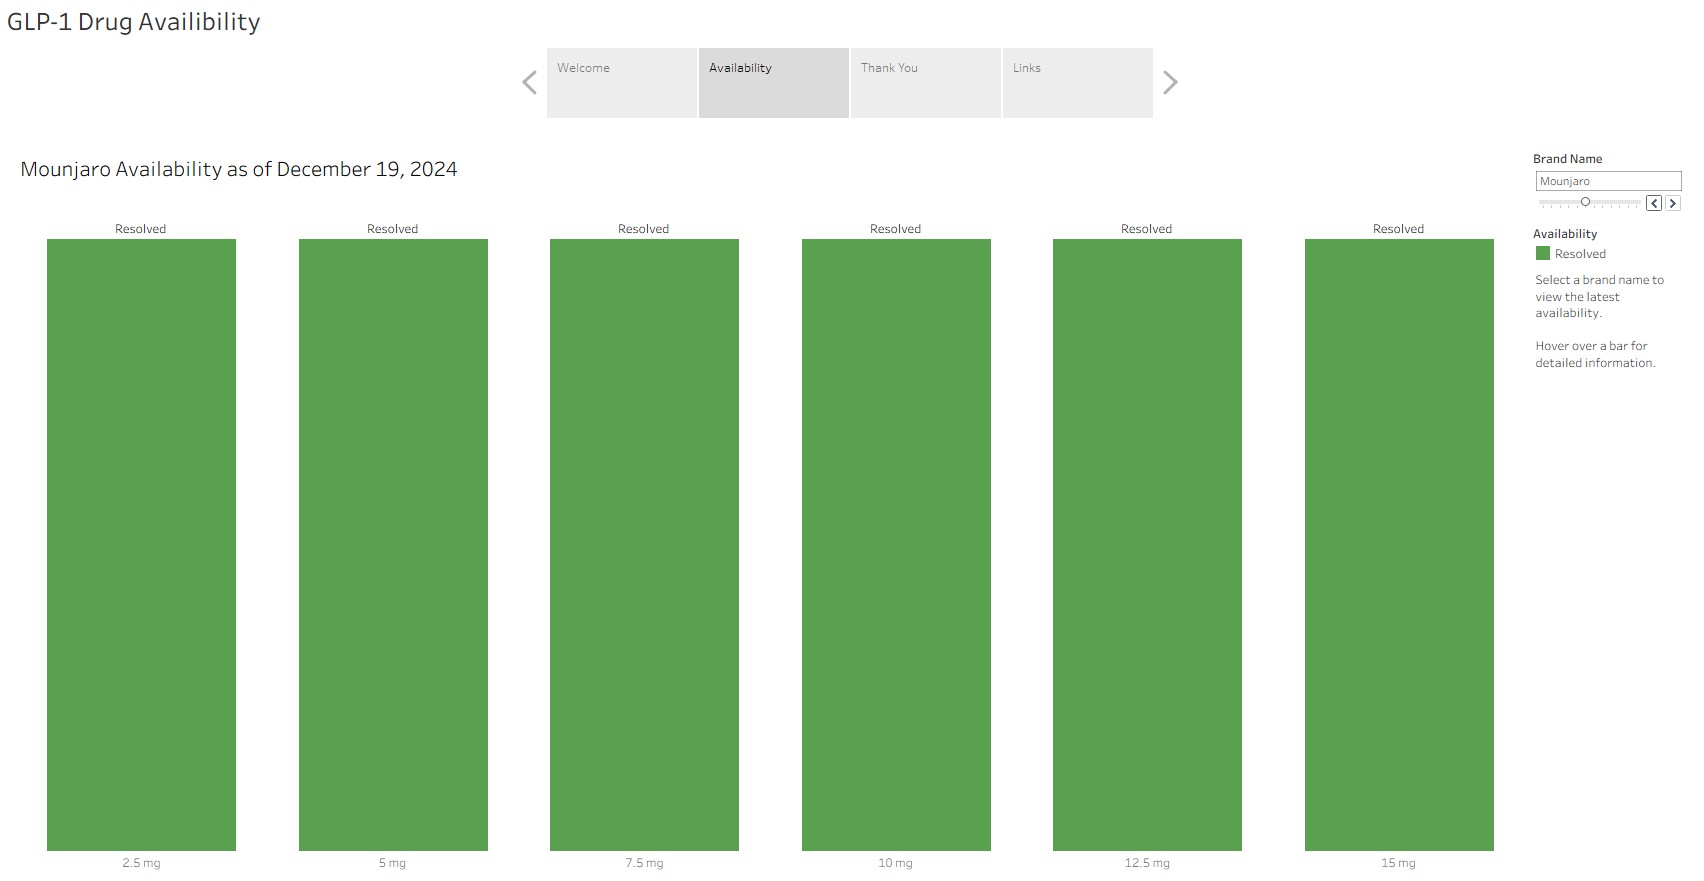
Python and SQLite make drug shortage tracking reliable, efficient, and change-driven.
Avoiding redundant outputs and focusing only on real changes makes drug shortage tracking both more efficient and more reliable. Python and SQLite work together to compare new data with existing records, ensuring updates occur only when needed and visualizations remain clear and accurate.
Key Points
Read more: Streamlined Drug Shortage Tracking with Python and SQLite
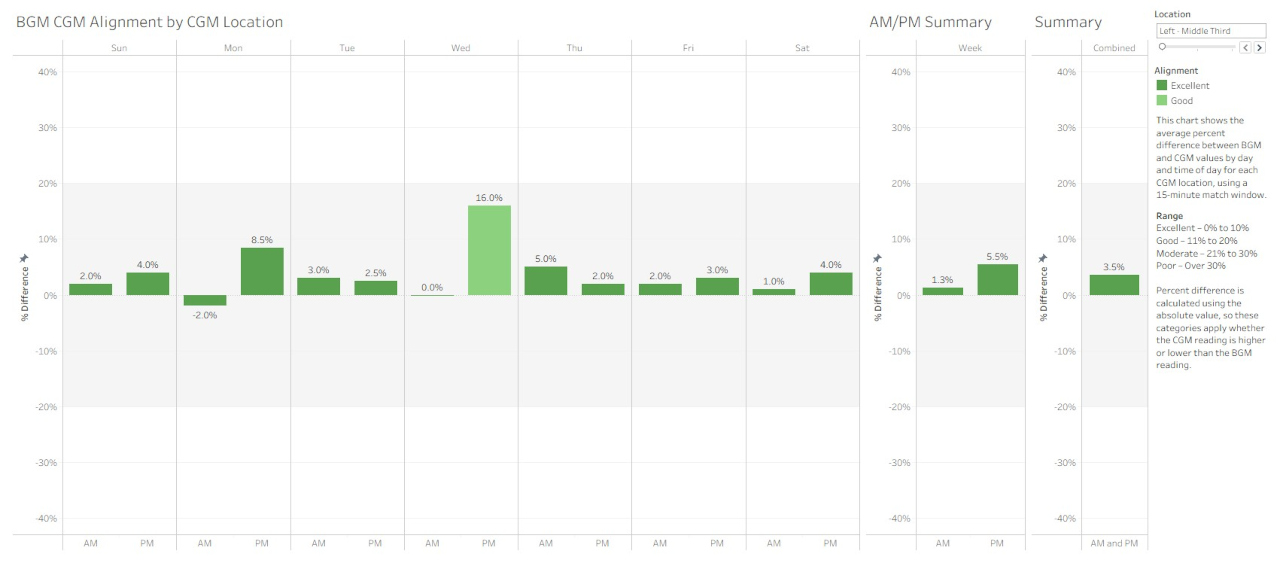
A data-driven look at how well continuous glucose monitor (CGM) readings align with blood glucose meter (BGM) readings—and what it reveals about device performance and sensor placement.
Abstract
Explore how Python and Tableau can be used to evaluate the alignment between continuous glucose monitor (CGM) and blood glucose meter (BGM) readings. By pairing readings within a 15-minute window and analyzing percent differences over time and by sensor location, the project identifies patterns in device performance and helps validate sensor placement.
Key Points
Read more: Aligning CGM and BGM Readings Using Python and Tableau
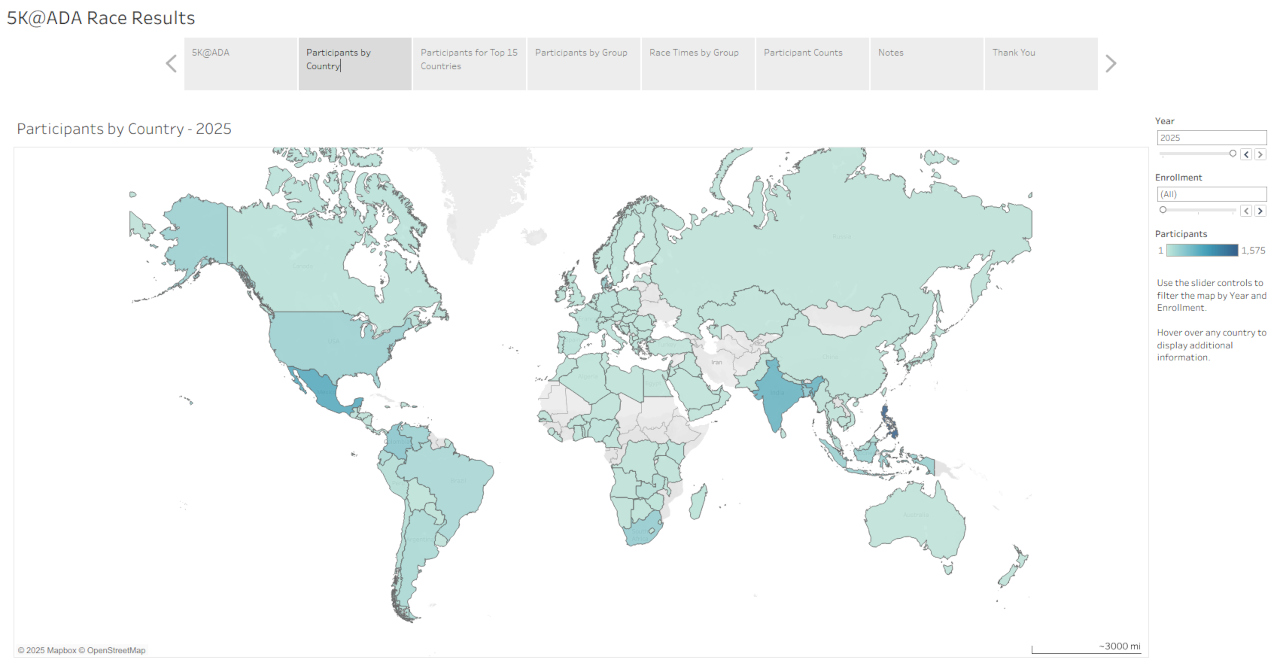
A project’s real value comes from how well it adapts as the data changes.
Abstract
The 5K@ADA race results project has been updated for 2025 with improvements to data storage, cleaning, and visualization. Key enhancements include the use of SQLite for managing multi-year data, SQL-based deduplication, handling of multilingual gender values, and updated Tableau dashboards with year-based logic. These changes improve scalability, accuracy, and long-term usability.
Key Points
Read more: Adapting the 5K@ADA Race Results Project for 2025
%%sql
-- Find the total count of duplicate rows in the CLARITY_DATA table
SELECT SUM(duplicate_count - 1) AS total_duplicates
FROM (
    SELECT COUNT(*) AS duplicate_count
    FROM CLARITY_DATA
    GROUP BY Date, Time, DateTime, Value, Treatment, Source
    HAVING COUNT(*) > 1
) as duplicates;
Abstract
A comprehensive 4-part series on analyzing continuous glucose monitor (CGM) data using Python, SQLite, and Tableau. Each part focuses on a specific step of the process, from building a clean dataset to creating interactive visualizations. Designed to be accessible for readers of all expertise levels, the series provides practical guidance for managing and interpreting CGM data. The post also links to each detailed article, providing a clear pathway for readers to follow the project step by step.
Key Points
Purpose of the Series: Guide readers through the process of analyzing CGM data, demonstrating practical applications of Python, SQLite, and Tableau.
Read more: Working with CGM Data: Python, SQLite, and Tableau in a 4-Part Series