


I completed Personalised Medicine from a Nordic Perspective through the University of Copenhagen and University of Iceland. The course explored how biobanks (collections of biological samples), health registries, and biomarkers (measurable health indicators) can be used to guide individual care, while also addressing risk communication, data protection, and broader ethical considerations.
For a data analyst, this provides valuable context for how health data is generated and applied, and shows the importance of collaboration between doctors and data scientists. The Nordic countries offer a strong case study: they maintain comprehensive health registries and biobanks, and are leaders in responsible data sharing across sectors. The material is presented in a way that makes these complex topics accessible to a broader audience, not just specialists.
This course was built and launched by two principal collaborators, Sisse Rye Ostrowski, MD, University of Copenhagen and Sædís Sævarsdóttir, MD, University of Iceland. They summed up its importance this way:
“The healthcare system is a wonderful place to be if you’re interested in data and developing algorithms. There are extremely complex data like omics data, register data, and data from wearables with all kinds of measurements you could possibly imagine. So, the healthcare field is the data playground of the future.” - Ostrowski
“We want people to understand the challenges involved and how collaboration and technological innovation is the key to shaping the future of healthcare.” - Sævarsdóttir
Explore the Course: Personalised Medicine from a Nordic Perspective
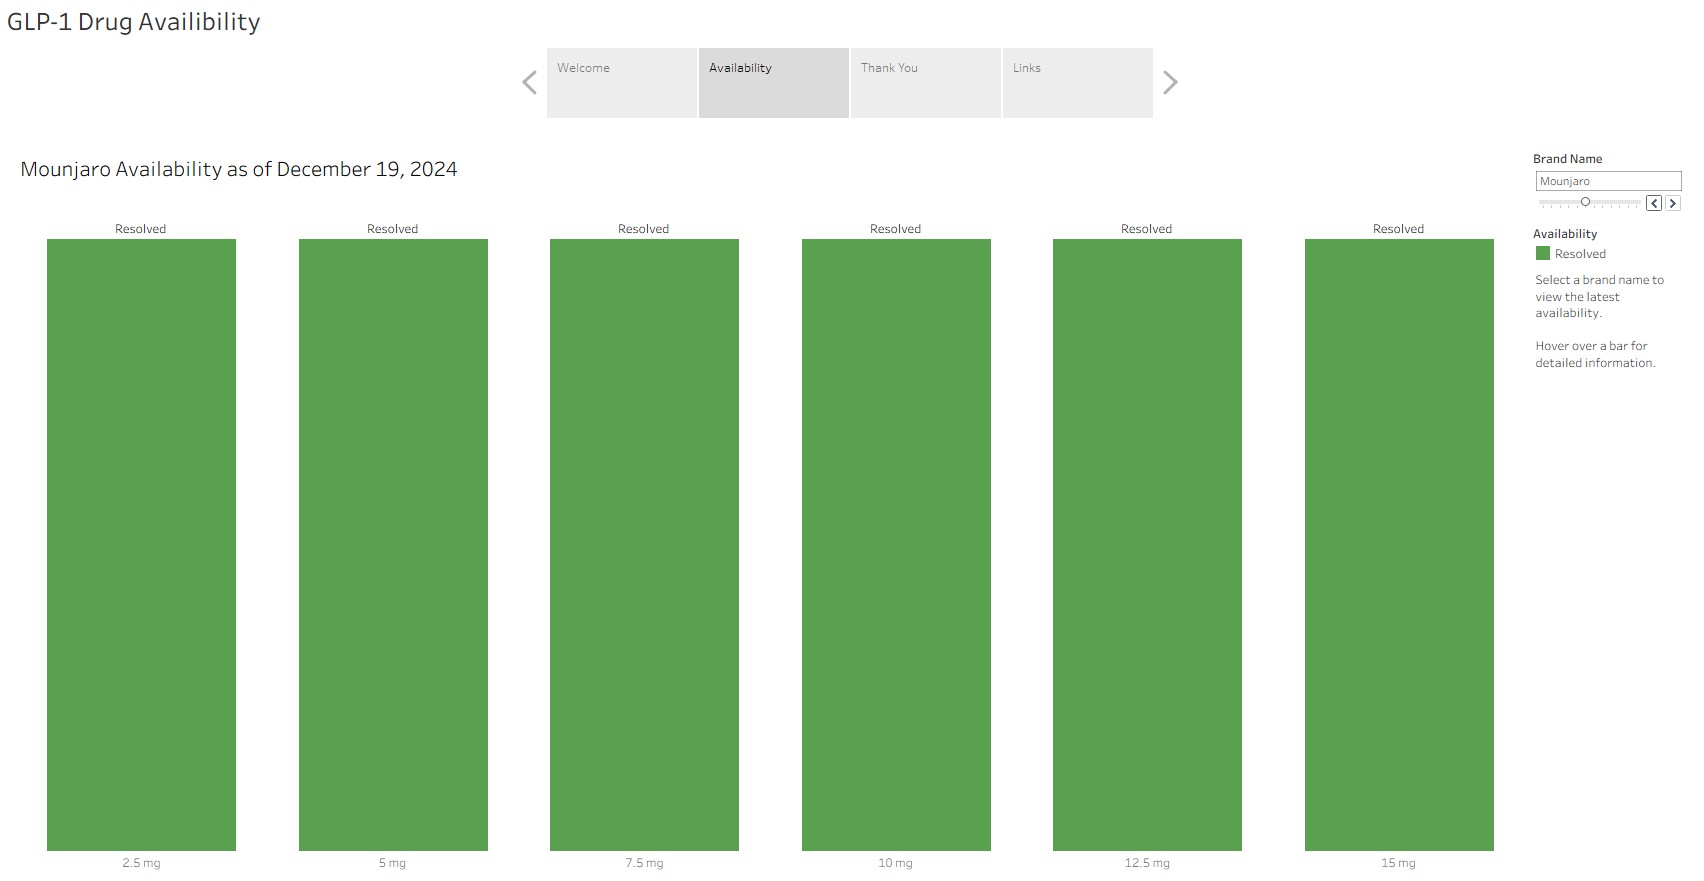
Python and SQLite make drug shortage tracking reliable, efficient, and change-driven.
Avoiding redundant outputs and focusing only on real changes makes drug shortage tracking both more efficient and more reliable. Python and SQLite work together to compare new data with existing records, ensuring updates occur only when needed and visualizations remain clear and accurate.
Key Points
Read more: Streamlined Drug Shortage Tracking with Python and SQLite

A data-driven look at how well continuous glucose monitor (CGM) readings align with blood glucose meter (BGM) readings—and what it reveals about device performance and sensor placement.
Abstract
Explore how Python and Tableau can be used to evaluate the alignment between continuous glucose monitor (CGM) and blood glucose meter (BGM) readings. By pairing readings within a 15-minute window and analyzing percent differences over time and by sensor location, the project identifies patterns in device performance and helps validate sensor placement.
Key Points
Read more: Aligning CGM and BGM Readings Using Python and Tableau

A project’s real value comes from how well it adapts as the data changes.
Abstract
The 5K@ADA race results project has been updated for 2025 with improvements to data storage, cleaning, and visualization. Key enhancements include the use of SQLite for managing multi-year data, SQL-based deduplication, handling of multilingual gender values, and updated Tableau dashboards with year-based logic. These changes improve scalability, accuracy, and long-term usability.
Key Points
Read more: Adapting the 5K@ADA Race Results Project for 2025
Page 2 of 9


![]()

