
Abstract
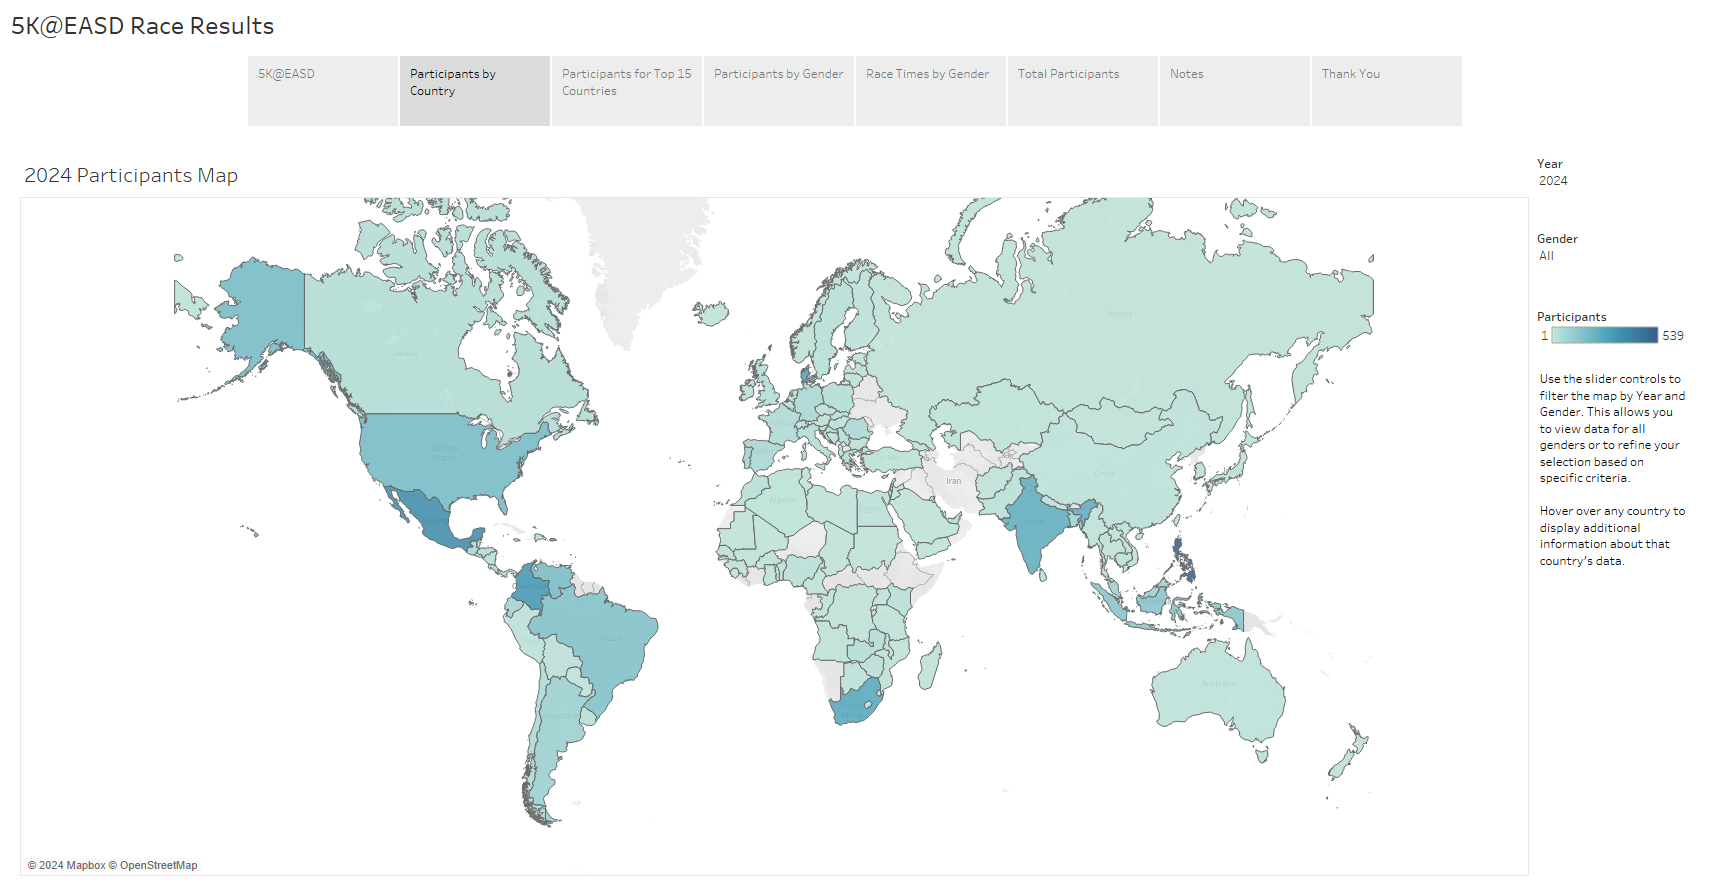
This post explores participation trends from the 2023 and 2024 5K@EASD events, highlighting the role of physical activity in diabetes management. Key insights include geographic distribution, gender-based participation, and race performance trends. Interactive Tableau visualizations offer a detailed, data-driven analysis of how the event's engagement has evolved over two years.
Key Points

Abstract
Explore advanced Python techniques for efficient data retrieval, focusing on handling large datasets, optimizing API calls, and ensuring data integrity. Whether you're working in healthcare analytics, financial modeling, or large-scale data science, these strategies will enhance your workflow and analysis capabilities.
Key Points

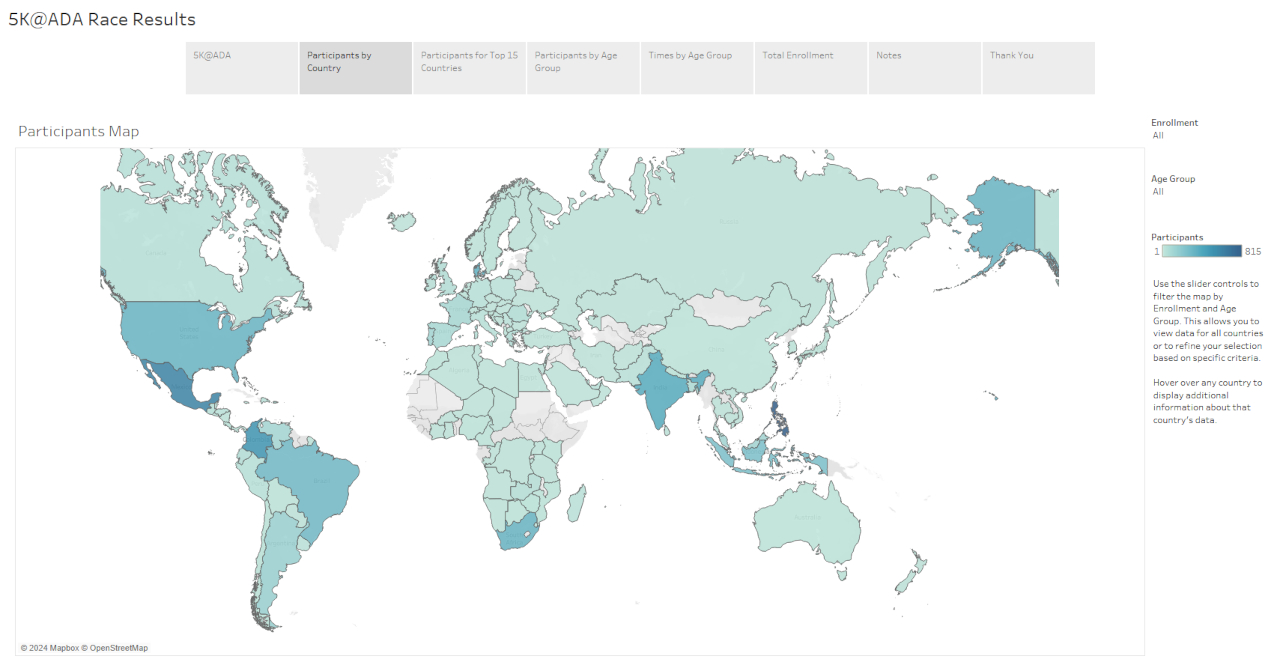
Explore the visualization of 5K@ADA race results using Tableau. Learn how to create interactive maps and charts that showcase geographic distribution and performance metrics. Discover how calculated fields and interactivity features in Tableau make the data analysis both engaging and informative.
Key Points

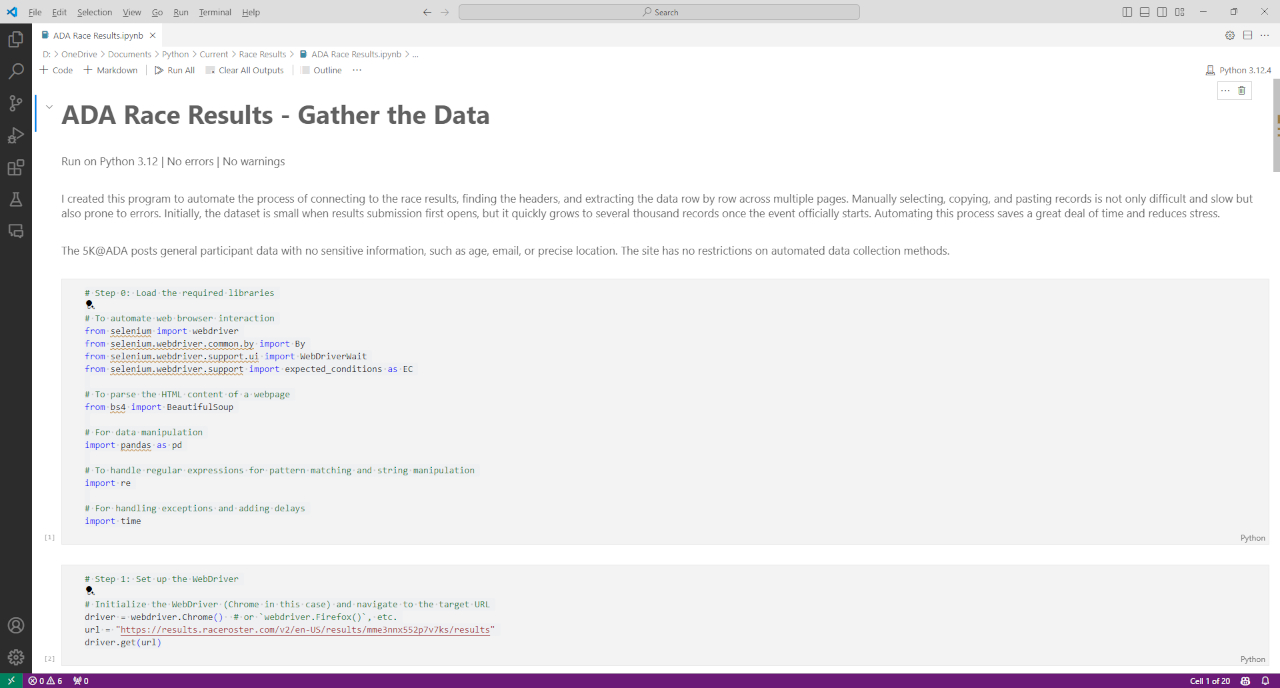
Explore the intricacies of web scraping with Python using advanced techniques to handle dynamic content and multi-page structures. Efficiently extract, clean, and prepare 5K@ADA race results data for analysis with Selenium and BeautifulSoup.
Key Points
Page 5 of 8